One of the precursor projects for Tropical Weather Analytics’ Hurricane Hunter Satellites was the CyMISS (Tropical Cyclone intensity Measurements from the ISS) project which ran from 2014 to 2019. Funded by a series of grants from CASIS (Center for the Advancement of Science in Space) which manages the ISS US National Laboratory for NASA, CyMISS was performed by the science team at Visidyne (the corporate antecedent of Tropical Weather Analytics) for NASA’s Tropical Cyclone Experiment as part of NASA’s CEO (Crew Earth Observations) activities on the International Space Station. The goal of CyMISS was to acquire image sequences of intense tropical cyclones (TCs), such as hurricanes and typhoons, from the ISS using a specially designed photography protocol (see “The Cyclone Intensity Measurements from the ISS (CyMISS)”) to support the development of stereographic imaging techniques of these destructive storms. These techniques will allow the altitudes of the cloud tops near the eye of TCs to be precisely determined so that these TCs can be more accurately characterized compared to existing remote sensing methods (see “Using the Carnot Engine Model to Characterize Hurricanes from Orbit”)
During the course of this five-year project, the CyMISS science team (which is now the TWA science team) amassed a large collection of storm images that we wish to share. One of the TCs observed in support of CyMISS by the crew of ISS Expedition 44 was the powerful Pacific storm, Super Typhoon Atsani, observed on August 19, 2015.
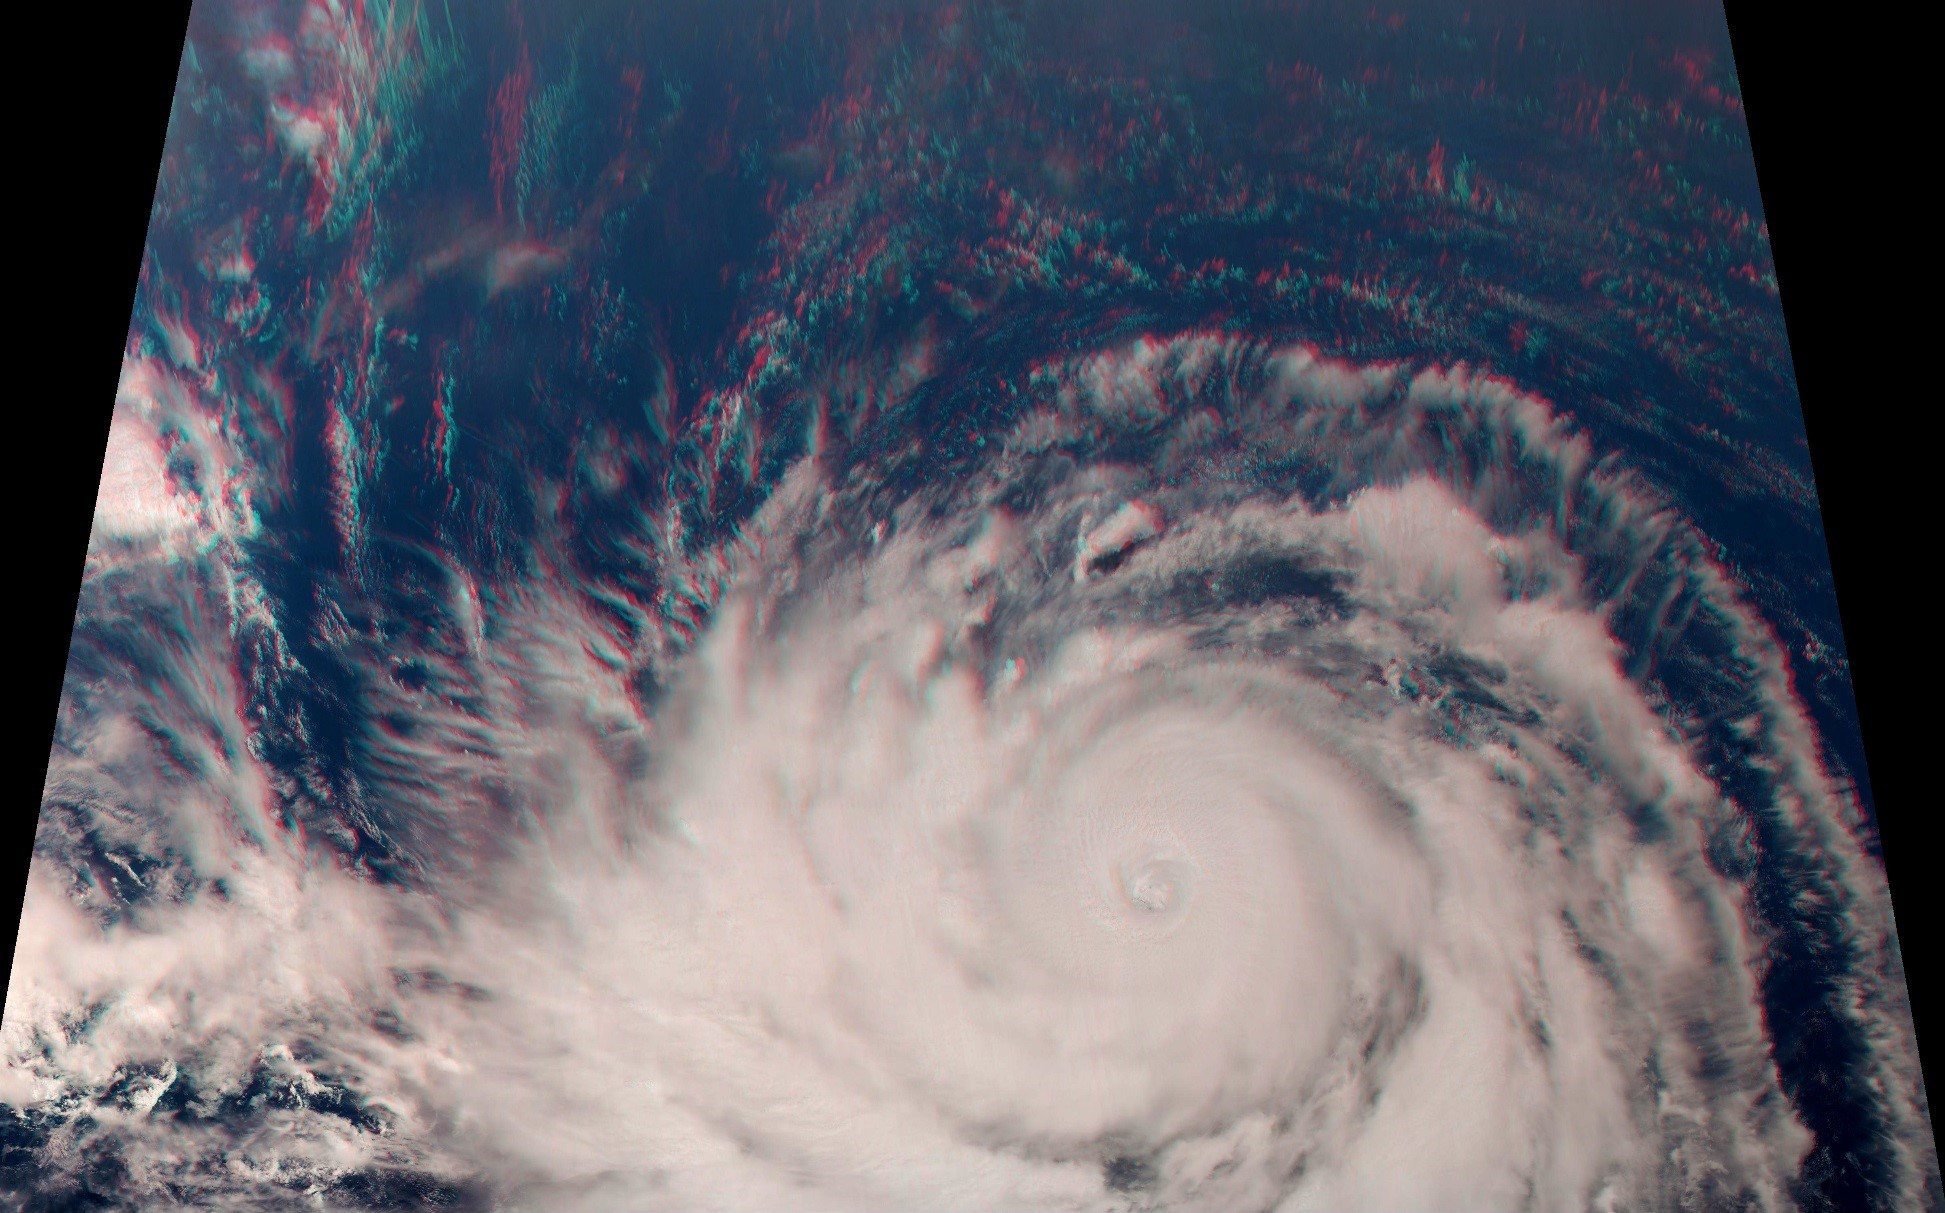
This storm was among the first intense tropical cyclones to be observed from the ISS using the project’s photography protocol which was specially designed to help create pseudo-stereo views from orbit. A total of 360 photographs, like the examples shown in the video above, were acquired by the crew of Expedition 44 during a six-minute observation session which started at 01:08:00 GMT (see “ISS Daily Summary Report – 08/19/15”). At this time, Atsani was located in the western part of the North Pacific at about 152.7° E, 18.7° N and had just been upgraded a Category 4 “Super Typhoon”. A synoptic 3D view created from ISS photographs taken that day is shown below. In order to create this anaglyphic 3D image (left eye red, right eye blue), the individual photographs from the original image sequence were remapped to approximate an overhead view before various parts of the frames were stitched together into a synoptic 3D mosaic covering an area of approximately 2.400 by 1,500 kilometers. A high resolution version of this synoptic 3D mosaic with an image scale of ~1.3 kilometers/pixel can be viewed by clicking on the image below.
![]()
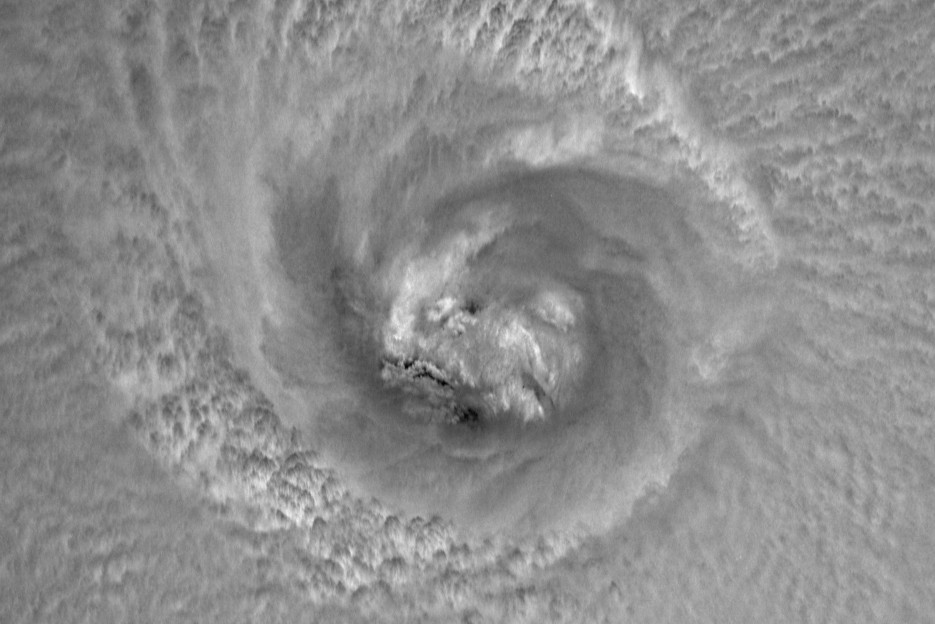
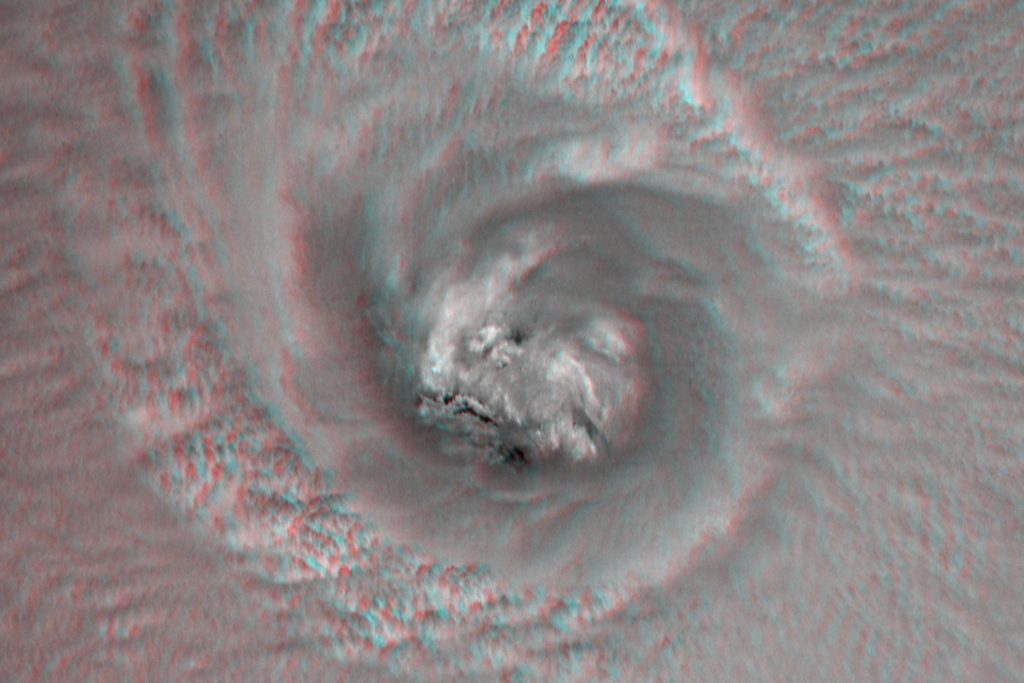
The 3D close up image below was created using a pair of images of the 50-kilometer eye of Super Typhoon Atsani taken a few seconds apart around 1:11:33 GMT. Only the red channel of the original color images was used in order to cut through any atmospheric haze and maximize the visibility of the cloud features. These images were remapped to approximate an overhead view before being combined to create an anaglyphic 3D image. The resulting stereo view, which can be viewed at full size by clicking on the image below, covers an area of 225 by 150 kilometers and clearly reveals the structure in and around the eye of Atsani when the surface winds were at 150 mph (242 kph).
![]()
Related Reading
Drew LePage, “The Hurricane Hunter Satellites”, Drew Ex Machina, May 15, 2022 [Post]
Drew LePage, “Using the Carnot Engine Model to Characterize Hurricanes from Orbit”, TWA Blog, July 23, 2022 [Post]
Drew LePage, “Turn Up the Stereo”, TWA Blog, March 3, 2022 [Post]
Paul Joss, “The Cyclone Intensity Measurements from the ISS (CyMISS)”, Space Station Research Explorer [Page]
Paul Joss, A.T. Stair, and Andrew LePage, “Looking in the Eye of a Hurricane”, SS360: The ISS National Lab Blog, February 19, 2016 [Article]
