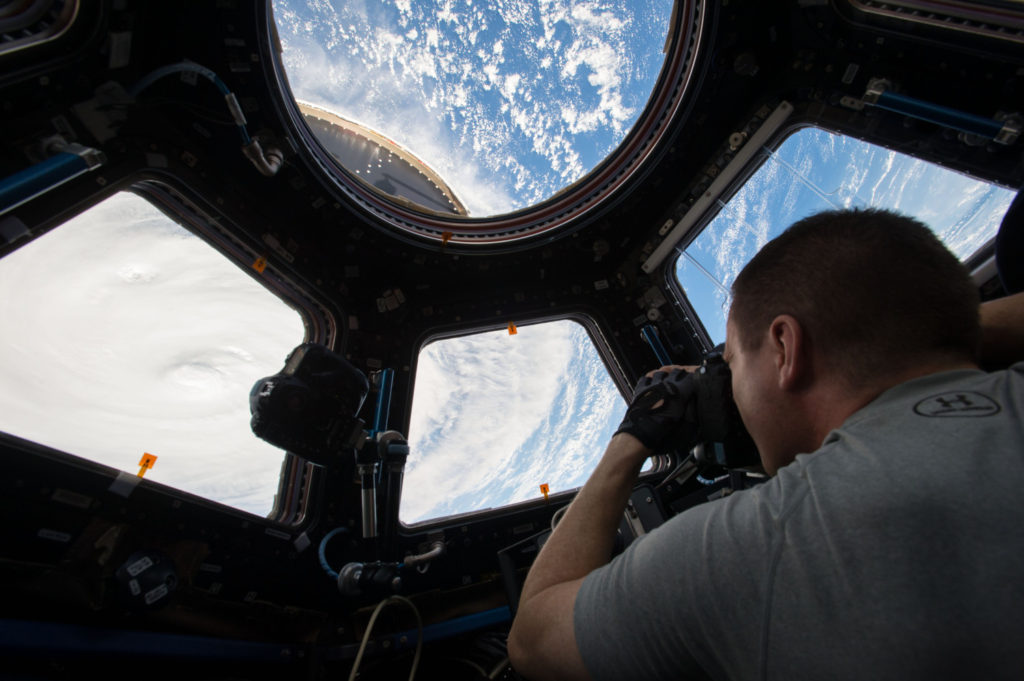
One of the precursor projects for Tropical Weather Analytics’ Hurricane Hunter Satellites was the CyMISS (Tropical Cyclone intensity Measurements from the ISS) project which ran from 2014 to 2019. Funded by a series of grants from CASIS (Center for the Advancement of Science in Space) which manages the ISS US National Laboratory for NASA, CyMISS was performed by the science team at Visidyne (the corporate antecedent of Tropical Weather Analytics) for NASA’s Tropical Cyclone Experiment as part of NASA’s CEO (Crew Earth Observations) activities on the International Space Station. The goal of CyMISS was to acquire image sequences of intense tropical cyclones (TCs), such as hurricanes and typhoons, from the ISS using a specially designed photography protocol (see “The Cyclone Intensity Measurements from the ISS (CyMISS)”) to support the development of stereographic imaging techniques of these destructive storms. These techniques will allow the altitudes of the cloud tops near the eye of TCs to be precisely determined so that these TCs can be more accurately characterized compared to existing remote sensing methods (see “Using the Carnot Engine Model to Characterize Hurricanes from Orbit”)
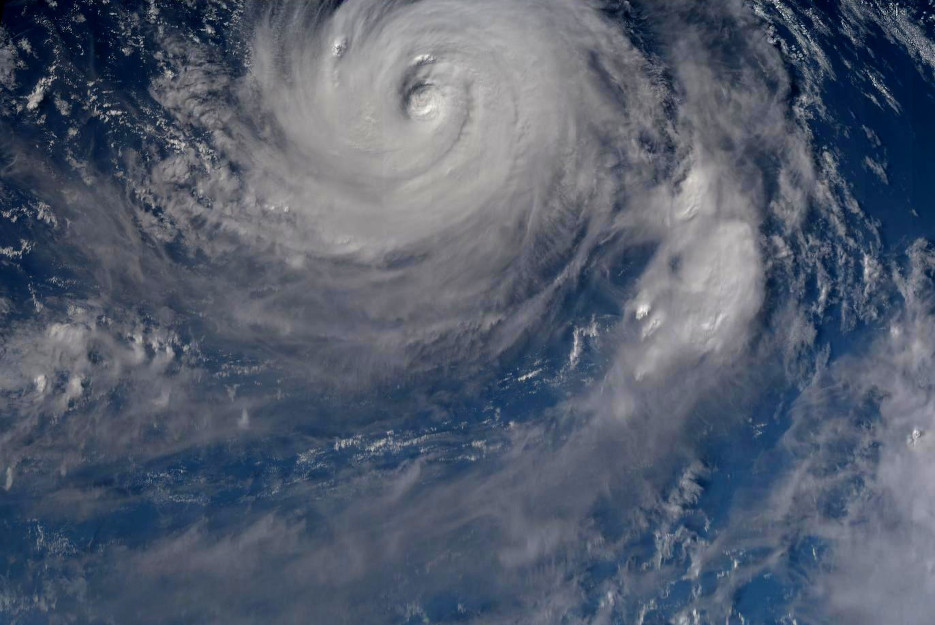
During the course of this five-year project, the CyMISS science team (which is now the TWA science team) amassed a large collection of storm images that we wish to share. One of the TCs observed in support of CyMISS by the crew of ISS Expedition 52 in 2017 was the powerful Pacific storm, Typhoon Noru.
A 3D synoptic view of Typhoon Noru was created using images from a sequence of 240 photographs taken by the crew of the ISS during an overpass on August 1, 2017 as pictured above (see “ISS Daily Summary Report – 8/01/2017”). When the four-minute photography session started at 07:25:00 GMT, Noru was located at about 24.1° N, 137.6° E in the western Pacific Ocean. Although Noru had strengthened rapidly during the last couple of days of July to peak at Category 5 on the Saffir-Simpson scale making it a “Super Typhoon”, Noru had begun to weaken steadily during the day and a half before this observation session. At the time of the CyMISS photography session, Typhoon Noru had weakened to a Category 3 storm with sustained winds of about 185 kph (115 mph). In order to create the anaglyphic 3D image (left eye red, right eye blue) shown below, the individual photographs from the original image sequence were remapped to approximate an overhead view before various parts of the frames were stitched together into a synoptic 3D mosaic covering an area of approximately 1,350 by 900 kilometers. A high resolution version of this synoptic 3D mosaic with an image scale of ~700 meters/pixel can be viewed by clicking on the image below.
![]()
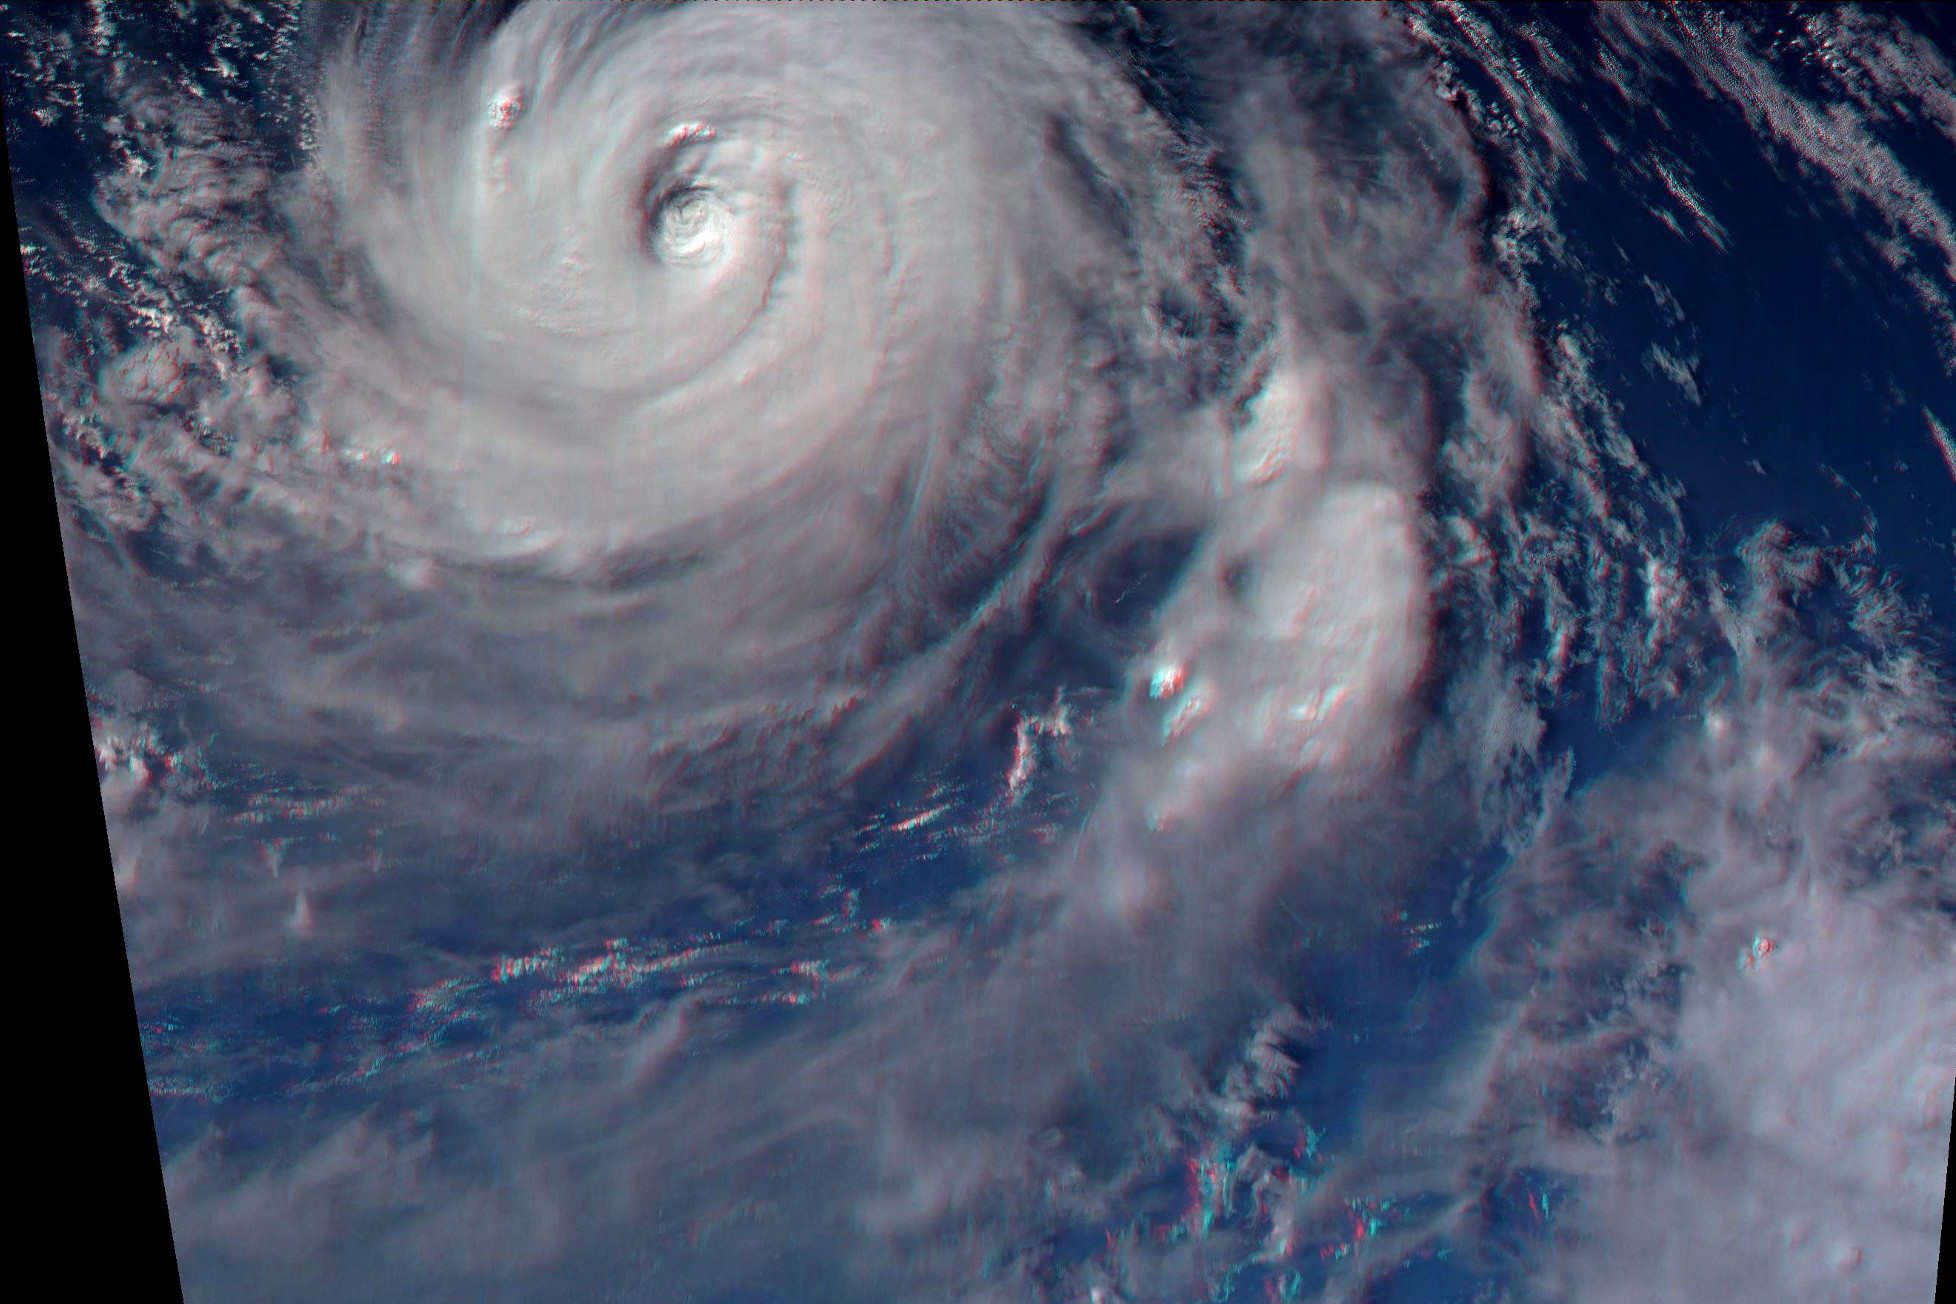
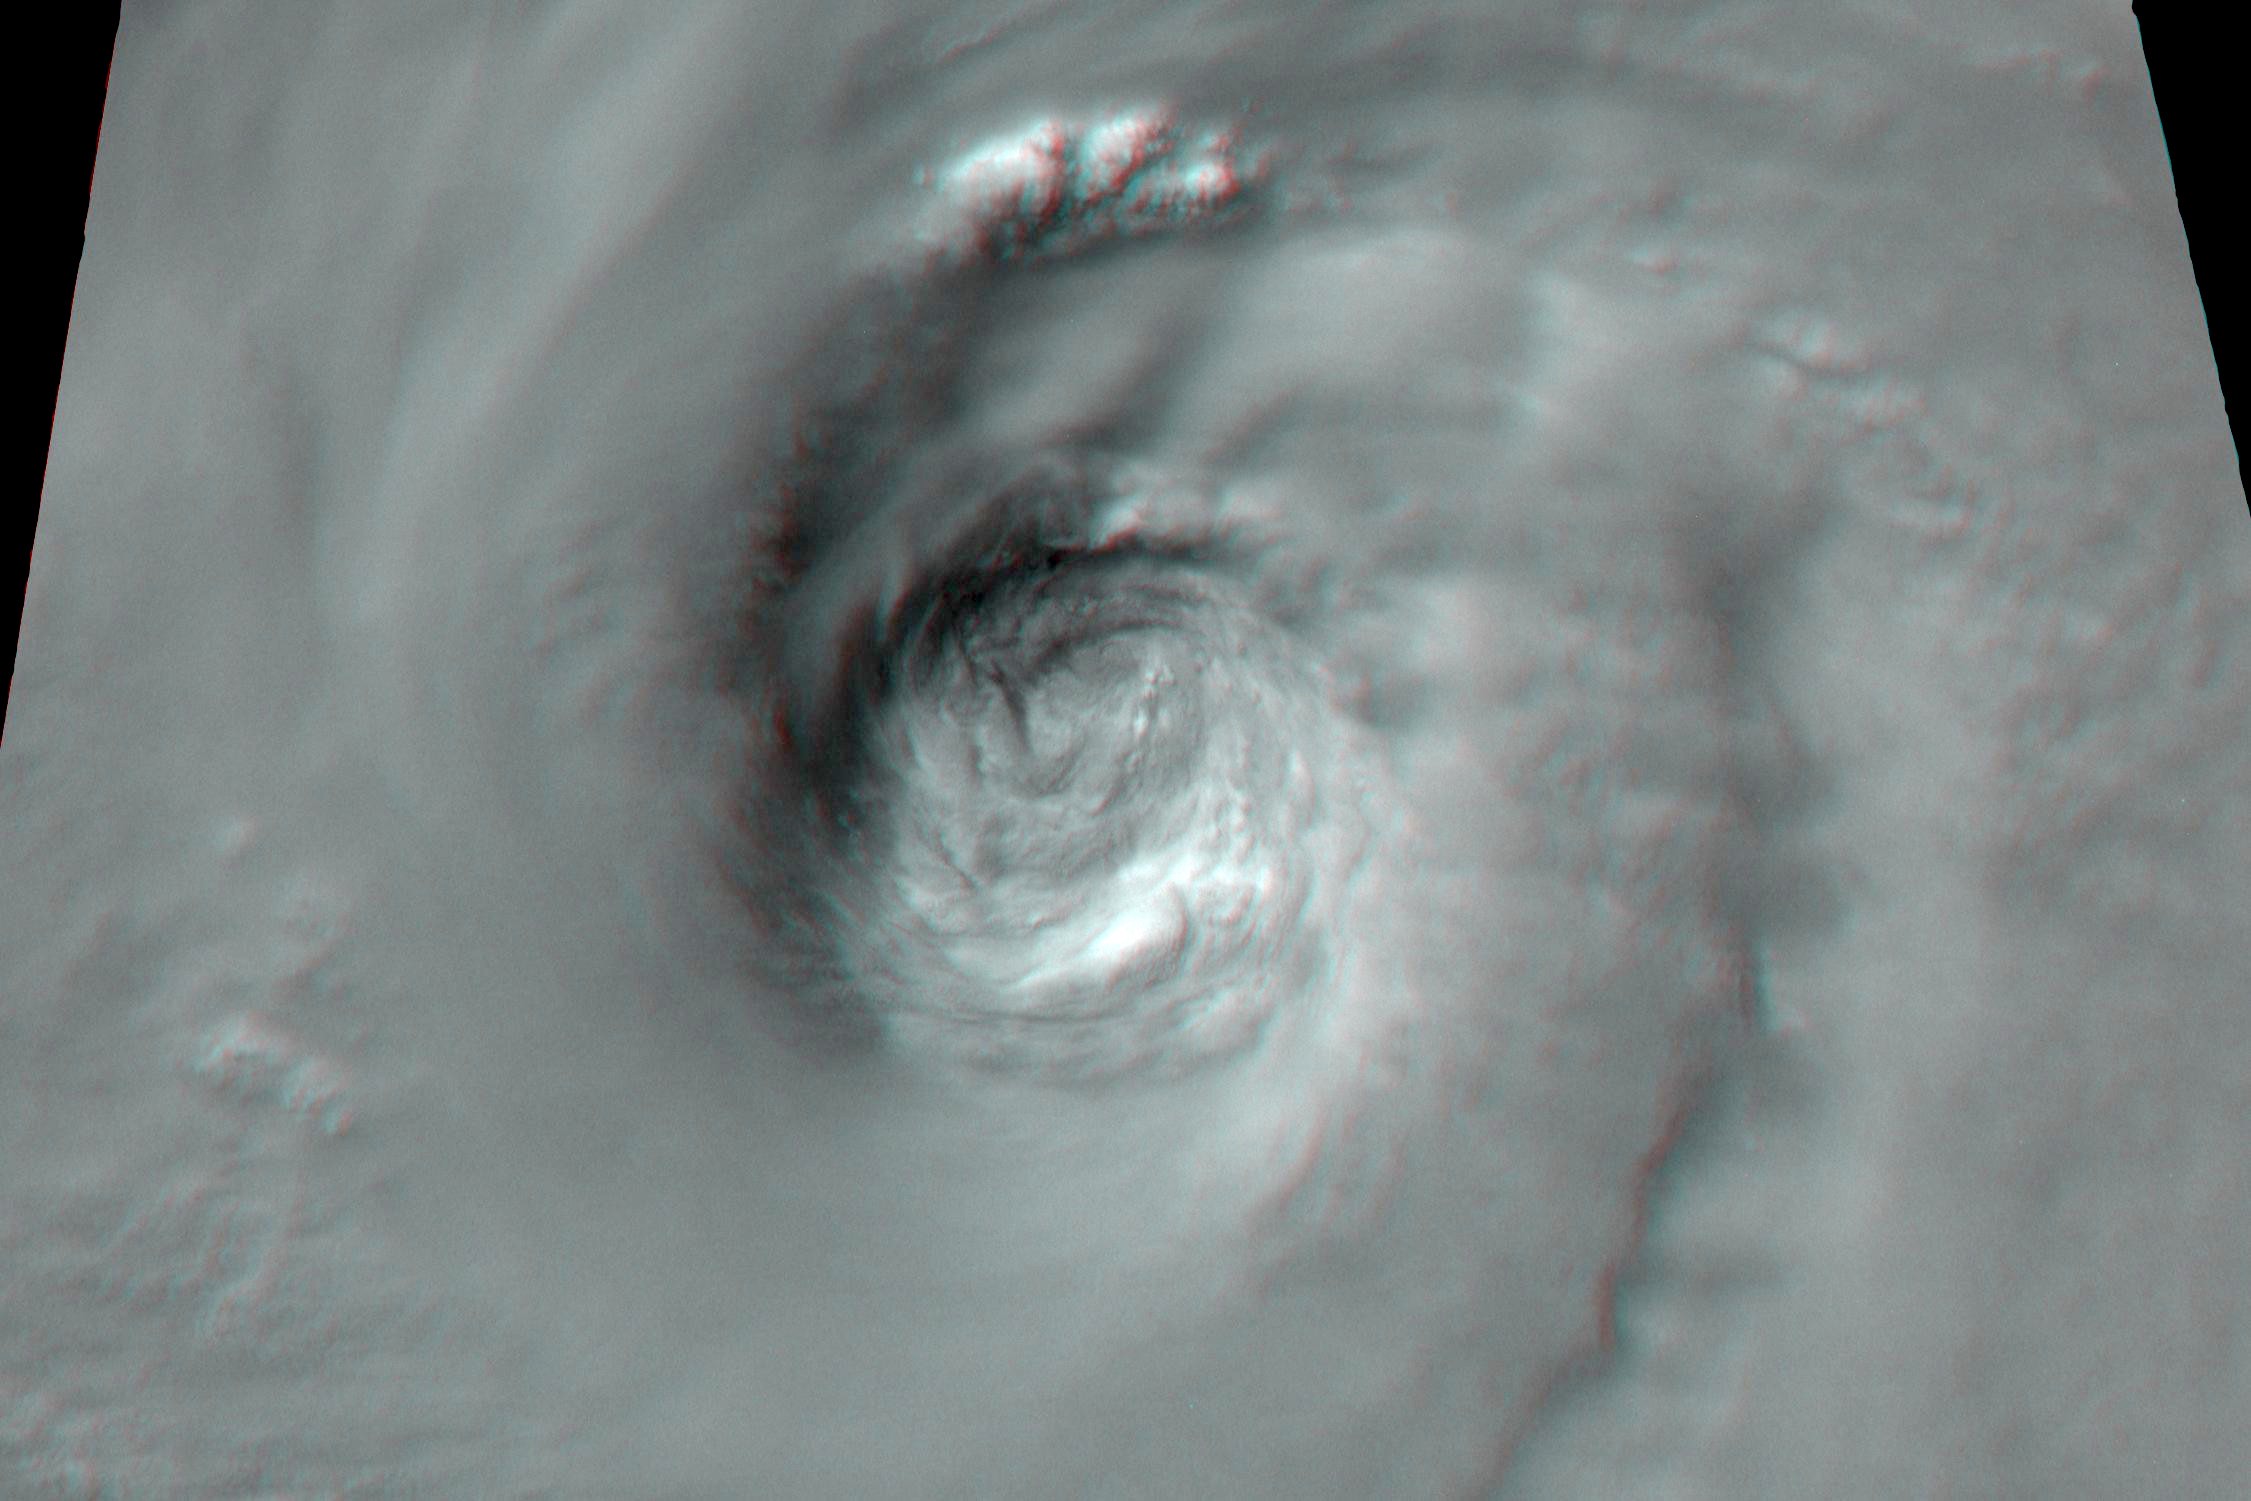
As can be seen in the wide area context image, the eye of Typhoon Noru presents a lot of interesting structure. It is readily seen that the clouds of Typhoon Noru stand far above those not associated with the storm. A closeup 3D image shown below was created using a pair of raw, 12-bit/color-plane images of the 60-kilometer eye of Typhoon Noru taken a few seconds apart around 07:26:44 GMT. Only the red channel of the original color images was used in order to cut through any atmospheric haze and maximize the visibility of the cloud features. These images were remapped to approximate an overhead view and had their contrast stretched before being combined to create an anaglyphic 3D image. The resulting 3D view, which can be viewed at full size of 100 meters/pixel by clicking on the image below, covers an area of 225 by 150 kilometers.
![]()
Related Reading
Drew LePage, “The Hurricane Hunter Satellites”, Drew Ex Machina, May 15, 2022 [Post]
Drew LePage,”Using the Carnot Engine Model to Characterize Hurricanes from Orbit”, TWA Blog, July 23, 2022 [Post]
Drew LePage, “Turn Up the Stereo”, TWA Blog, March 3, 2022 [Post]
Paul Joss, “The Cyclone Intensity Measurements from the ISS (CyMISS)”, Space Station Research Explorer [Page]
Bill Keeter, “ISS Daily Summary Report – 8/1/2017”, ISS On-Orbit Status Report, August 1, 2017 [Post]
