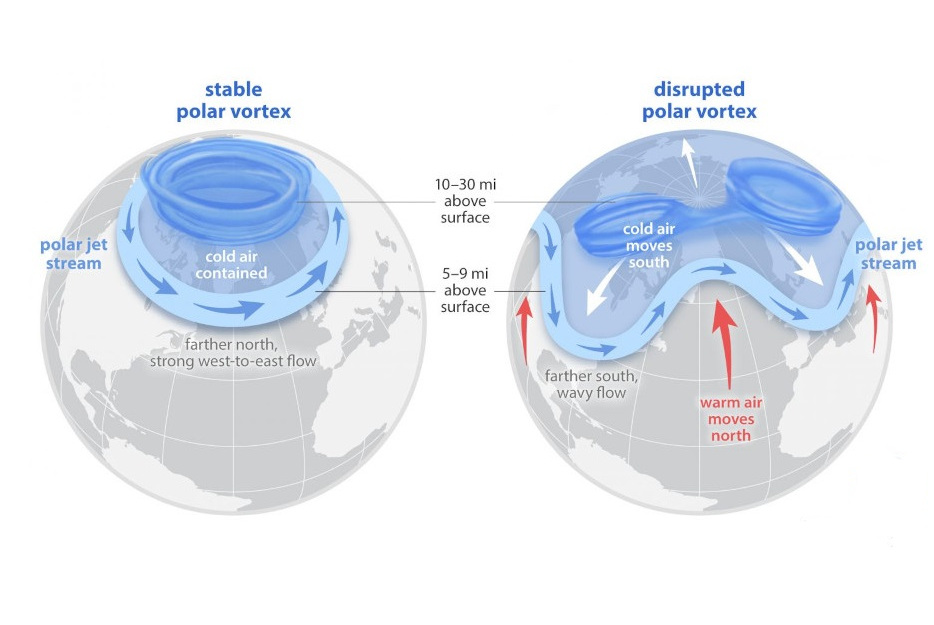
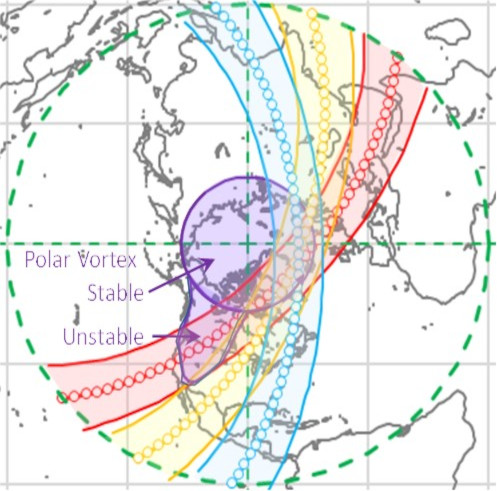
The Arctic Polar Vortex is a band of strong westerly winds that separates extremely cold air to the north from warmer air to the south. (A similar vortex is at the southern pole.) When the polar vortex is strong and stable, the separation latitude is typically about 50 degrees. At times (variable, but typically every other year), the vortex weakens, and the boundary becomes wobbly and can even split in two. The polar vortex is high in the stratosphere, however, between about 15 and 50 kilometers altitude, and while there is evidence that it strongly influences our weather at the surface, the interaction is not well understood.
The Polar Jet Stream forms a similar boundary between cold and warm air, but it is down in the troposphere, at altitudes from about 8 to 14 kilometers, and it does directly affect our weather at the surface by moving weather systems associated with temperature or precipitation. When the polar vortex is strong and stable, the polar jet stream typically lies as far north as 60 degrees latitude. When the polar vortex weakens, the polar jet stream also becomes wobbly and can dip southward as far as 30 degrees latitude. (At times, it can even merge with the subtropical jet stream, a similar boundary between mid-latitude air and even warmer equatorial air.) The approximate altitude bands of the polar vortex, polar jet stream, atmospheric layers, and cloud types are presented in Figure 1.

The interactions between the vortex, the jet stream, and our surface weather are complex and not well understood. The weakening of the polar vortex is thought to be associated with sudden stratospheric warmings – when strong tropospheric winds break upward into the stratosphere to cause localized warming. Other instabilities may play a role, as it would be expected that the air on the cold side of the vortex boundary would be denser than the air on the warm side, leading to vertical winds and wind shear (updrafts adjacent to downdrafts). The dynamics of the polar jet stream seem to follow the change in the polar vortex, but the timing (~weeks following) and degree of change are highly variable and not well understood. There does not appear to be a long-term trend in the polar vortex behavior that would be associated with global warming, but data are very limited.
Observational Requirements for Numerical Weather Prediction (NWP) are for high quality wind profile data as input to initialize the computer models. The World Meteorological Organization (WMO), for example, maintains a Rolling (continually updated) Requirements Review process that provides a comprehensive database for Observation Requirements, Space-Based Capabilities, Surface-Based Capabilities, and Analyses. A recent summary of requirements for wind measurements by Stoffelen et al. (Stoffelen 2020) compares current capabilities against requirements:
“The required vertical resolution for weather and climate applications is about 1 kilometer in the troposphere and 2 kilometers in the stratosphere, where the typical horizontal wind vector accuracy requirement is 2 m s−1 at a required 1–6-hourly coverage. These requirements are not met today over the oceans, tropics, and most of the Southern Hemisphere.”
Radiosondes, which best meet the measurement requirements, have very limited spatial coverage (Figure 2, left). Note that the ocean areas, the Southern hemisphere, and the northern latitudes – where the Polar Vortex plays a critical role – are not well covered. Each balloon flight takes about 2 hours, and each location typically makes two measurements per day. Space-based Lidar provides lesser but very useful vertical profile data, but they require larger, more expensive satellites (for greater power requirements) and they sample profile data only in a narrow slice below the orbital track. Revisit times are consequently long. Several satellite systems measure horizontal winds by following cloud motion, but spatial resolution is inversely proportional to areal coverage and cloud (wind) altitude is typically inferred indirectly from radiometric signal and is consequently not accurate.

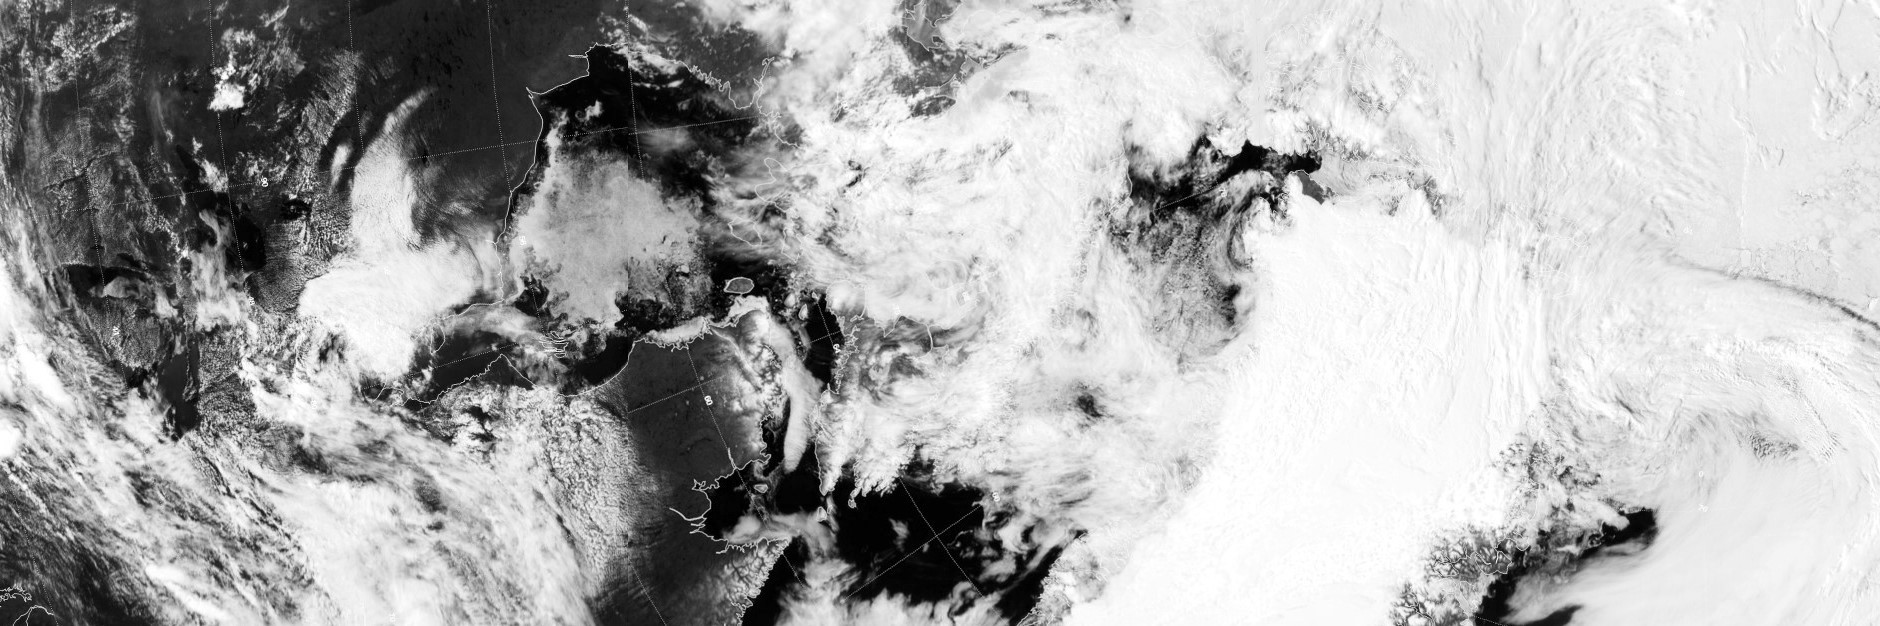
The TWA Hurricane Hunter Satellite (HHSat) Constellation will overcome these data shortcomings by combining wide earth coverage with measurement accuracy. We will make significant additions to the to 6D (location and velocity) wind measurements for a large swath (2,000 kilometers cross-track) anywhere that clouds have features (edges or shadows: refer to Figure 1). At any given time, two-thirds of the earth has cloud cover. The HHSat measurement approach employs pairs of low-cost micro satellites flying in tandem and making stereo measurements. The swath coverage for a single pair of satellites for three passes of a sample orbit (500 kilometer altitude, 94 minute period, 71-degree inclination) is presented in Figure 3 with a simulated HHSat image swath in Figure 4. Expected uncertainty from the stereo measurements and processing software will be on the order of one meter/second or better in all three dimensions in wind velocity, with altitude uncertainties of about 100 meters.
References
Ad Stoffelen et al., “Wind Profile Satellite Observation Requirements and Capabilities”, Bulletin of the American Meteorological Society, Vol. 101, Issue 11, December 2020 [Paper]
ECMWF (2004): European Centre for Medium-Range Weather Forecasts
Related Reading
Jay Jordano, “The Jet Streams and Their Future Characterization”, TWA Blog, July 18, 2022 [Post]
Drew LePage, “How Satellite Wind Data Impacts Weather Forecasting”, TWA Blog, May 23, 2022 [Post]
Drew LePage, “The Hurricane Hunter Satellites”, Drew Ex Machina, May 15, 2022 [Post]
