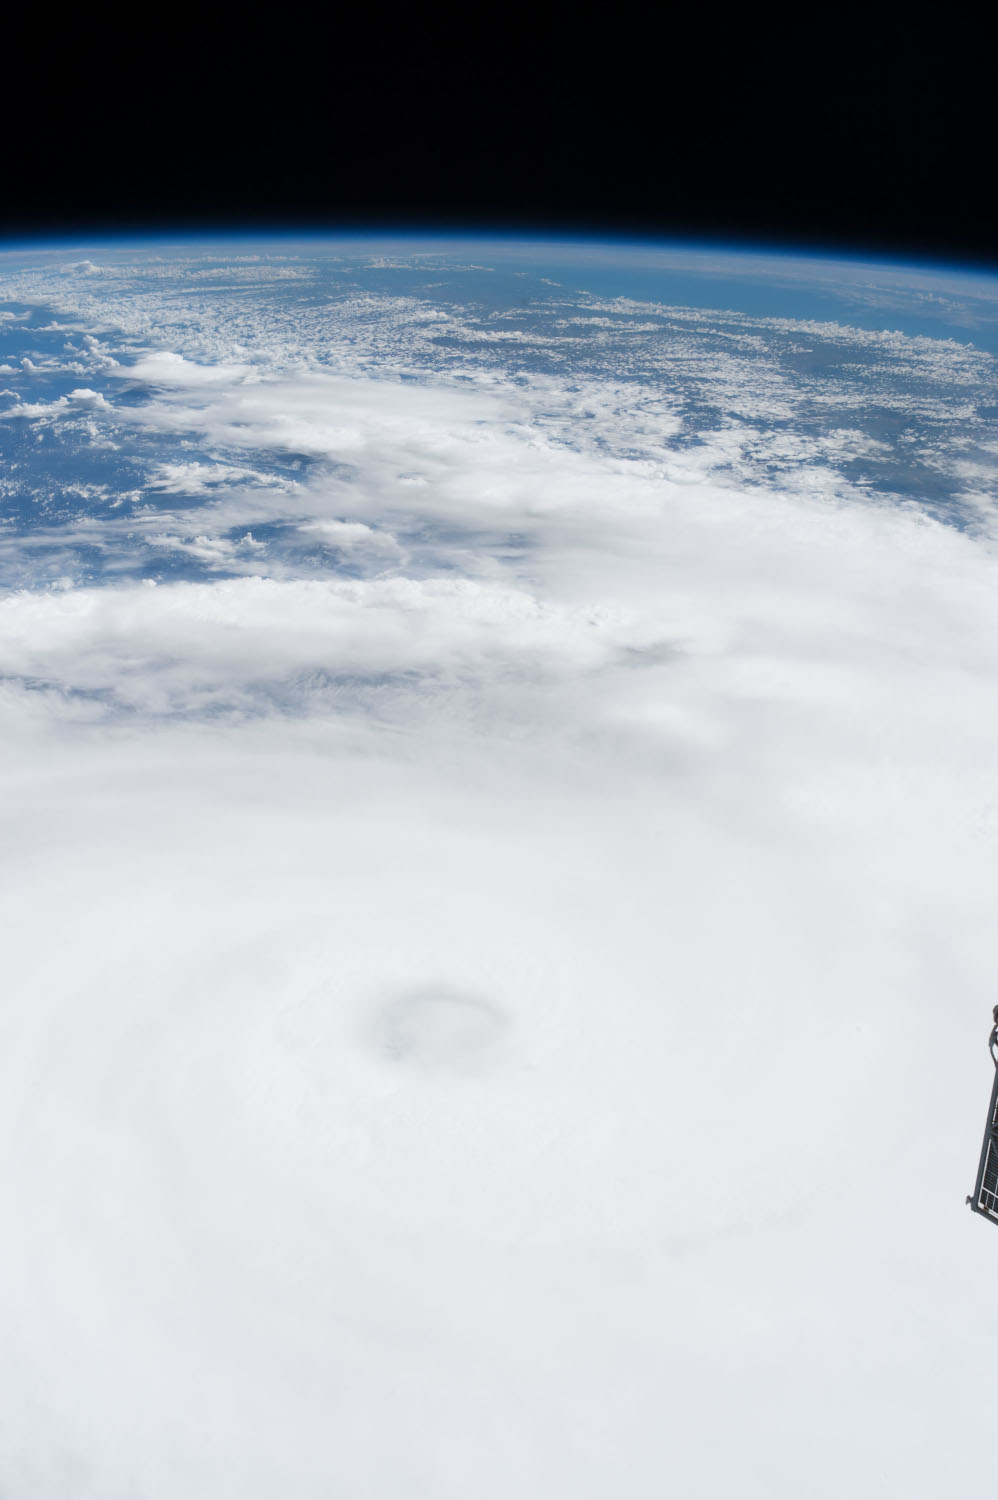
One of the precursor projects for Tropical Weather Analytics’ Hurricane Hunter Satellites was the CyMISS (Tropical Cyclone intensity Measurements from the ISS) project which ran from 2014 to 2019. Funded by a series of grants from CASIS (Center for the Advancement of Science in Space) which manages the ISS US National Laboratory for NASA, CyMISS was performed by the science team at Visidyne (the corporate antecedent of Tropical Weather Analytics) for NASA’s Tropical Cyclone Experiment as part of NASA’s CEO (Crew Earth Observations) activities on the International Space Station. The goal of CyMISS was to acquire image sequences of intense tropical cyclones (TCs), such as hurricanes and typhoons, from the ISS using a specially designed photography protocol (see “The Cyclone Intensity Measurements from the ISS (CyMISS)”) to support the development of stereographic imaging techniques of these destructive storms. These techniques will allow the altitudes of the cloud tops near the eye of TCs to be precisely determined so that these TCs can be more accurately characterized compared to existing remote sensing methods (see “Using the Carnot Engine Model to Characterize Hurricanes from Orbit”). Because of how these stereo images are acquired, processed, and analyzed, the motion of cloud features can also be tracked to derive the winds in three dimensions including unique measurements of vertical winds – a vital input for accurately modelling the future track and intensity of TCs (see “The Impact of New Satellite Wind Measurements on Hurricane & Tropical Cyclone Forecasting”)
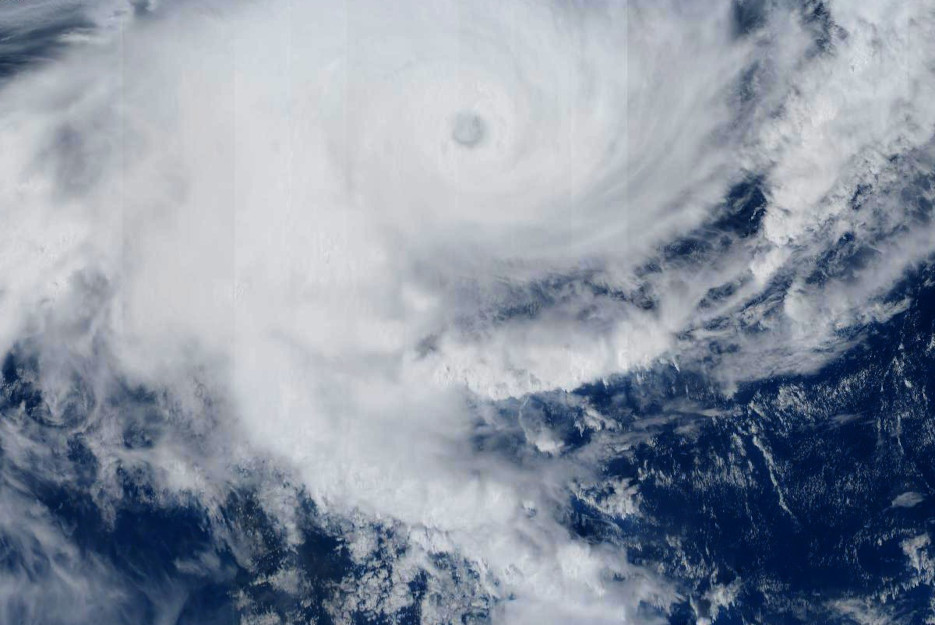
During the course of this five-year project, the CyMISS project science team (which is now the core of the TWA science team) amassed a large collection of storm images that we wish to share. One of the TCs observed in support of CyMISS by the crew of ISS Expedition 50 was Tropical Cyclone Enawo in the southwestern Indian Ocean on March 6, 2017.
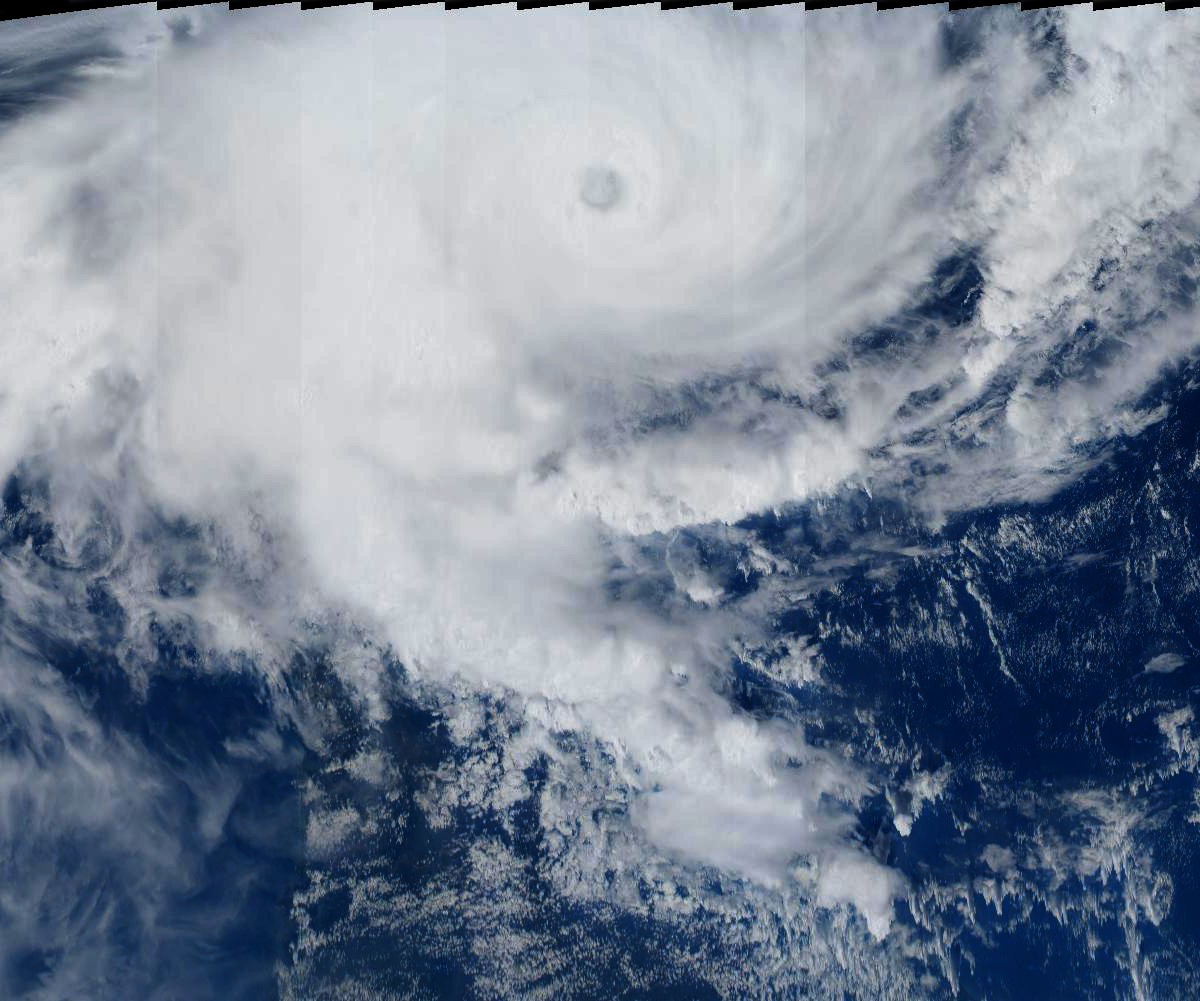
A total of 240 photographs, like the example shown above, were acquired of Tropical Cyclone Enawo by the crew of ISS Expedition 50 during a four-minute observation session which started at 10:33:00 GMT. At this time, the eye of Enawo was located at about 14.1°S, 53.3°E some 330 kilometers east of the northern tip of Madagascar in the southwestern Indian Ocean. Tropical Cyclone Enawo was strengthening at the time with an estimated average wind speed of 160 kph (100 mph) making it the equivalent of a Category 2 storm on the Saffir–Simpson scale. A synoptic 2D color view created from a subset of the ISS photographs taken that day is shown below. In order to create this mosaic, the individual photographs from the original image sequence were remapped to approximate an overhead view before the frames were stitched together into a synoptic view covering an area of approximately 1,200 by 1,000 kilometers. A high-resolution version of this 2D mosaic with an image scale of ~1,000 meters/pixel can be viewed by clicking on the image below. Note that this storm is rotating in a clockwise direction – the opposite direction to which we are accustomed to seeing in TCs in the northern hemisphere.
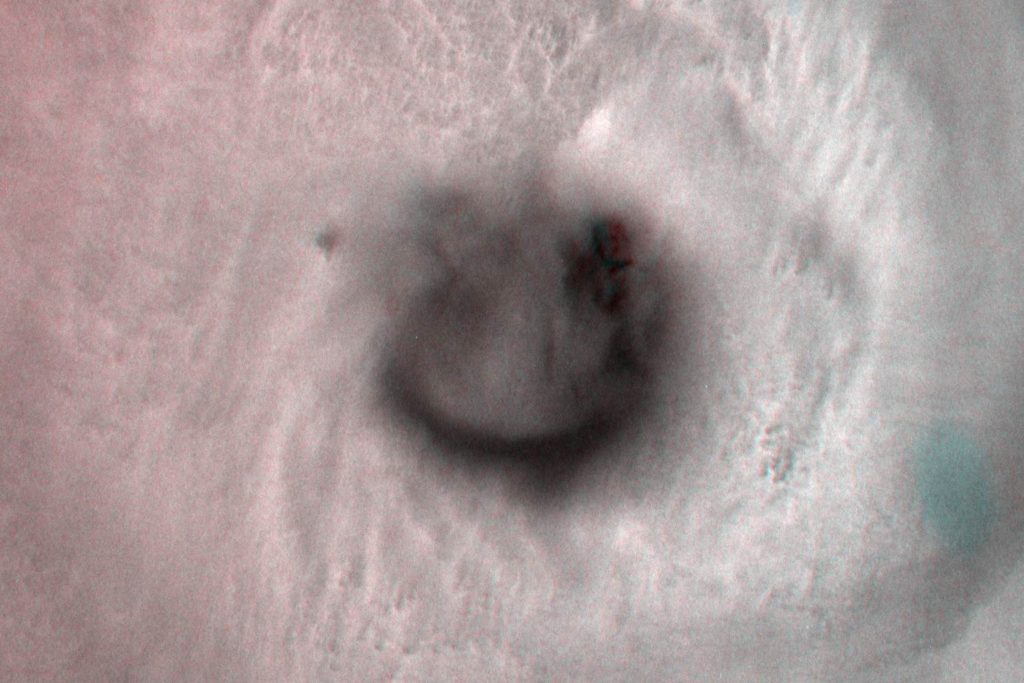
The close-up 3D image shown below was created using a pair of photographs of the 50-kilometer eye of Tropical Cyclone Enawo taken a few seconds apart around 10:35 GMT. Only the red channel of the original color images was used in order to cut through any atmospheric haze and maximize the visibility of the cloud features. These images were remapped to approximate an overhead view before being combined to create an anaglyphic 3D image. The resulting stereo view, which can be seen at full size with a scale of about 100 meters/pixel by clicking on the image below, covers an area of 150 by 100 kilometers. At this point in the storm’s development, the eye had filled in with clouds but would clear later in the day.
![]()
Related Reading
Drew LePage, “The Hurricane Hunter Satellites”, Drew Ex Machina, May 15, 2022 [Post]
Drew LePage, “Using the Carnot Engine Model to Characterize Hurricanes from Orbit”, TWA Blog, July 23, 2022 [Post]
Drew LePage, “The Impact of New Satellite Wind Measurements on Hurricane & Tropical Cyclone Forecasting”, TWA Blog, January 15, 2023 [Post]
Paul Joss, “The Cyclone Intensity Measurements from the ISS (CyMISS)”, Space Station Research Explorer [Page]
