One of the precursor projects for Tropical Weather Analytics’ Hurricane Hunter Satellites was the CyMISS (Tropical Cyclone intensity Measurements from the ISS) project which ran from 2014 to 2019. Funded by a series of grants from CASIS (Center for the Advancement of Science in Space) which manages the ISS US National Laboratory for NASA, CyMISS was performed by the science team at Visidyne (the corporate antecedent of Tropical Weather Analytics) for NASA’s Tropical Cyclone Experiment as part of NASA’s CEO (Crew Earth Observations) activities on the International Space Station. The goal of CyMISS was to acquire image sequences of intense tropical cyclones (TCs), such as hurricanes and typhoons, from the ISS using a specially designed photography protocol (see “The Cyclone Intensity Measurements from the ISS (CyMISS)”) to support the development of stereographic imaging techniques of these destructive storms. These techniques will allow the altitudes of the cloud tops near the eye of TCs to be precisely determined so that these TCs can be more accurately characterized compared to existing remote sensing methods (see “Using the Carnot Engine Model to Characterize Hurricanes from Orbit”). Because of how these stereo images are processed and analyzed, the motion of cloud features can also be tracked to derive the winds in three dimensions including unique measurements of vertical winds – a vital input for accurately modelling the future track and intensity of TCs (see “The Impact of New Satellite Wind Measurements on Hurricane & Tropical Cyclone Forecasting”)
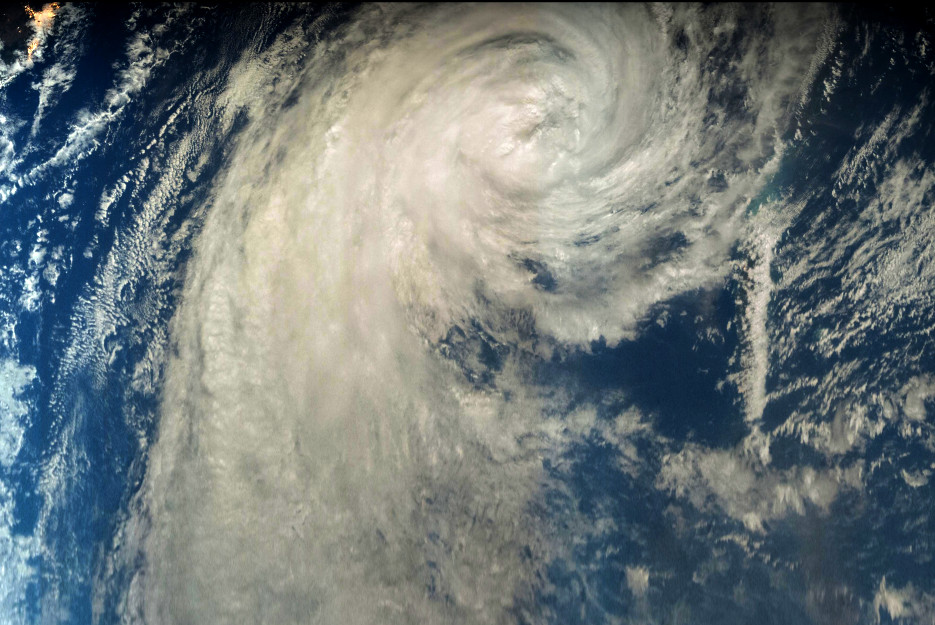
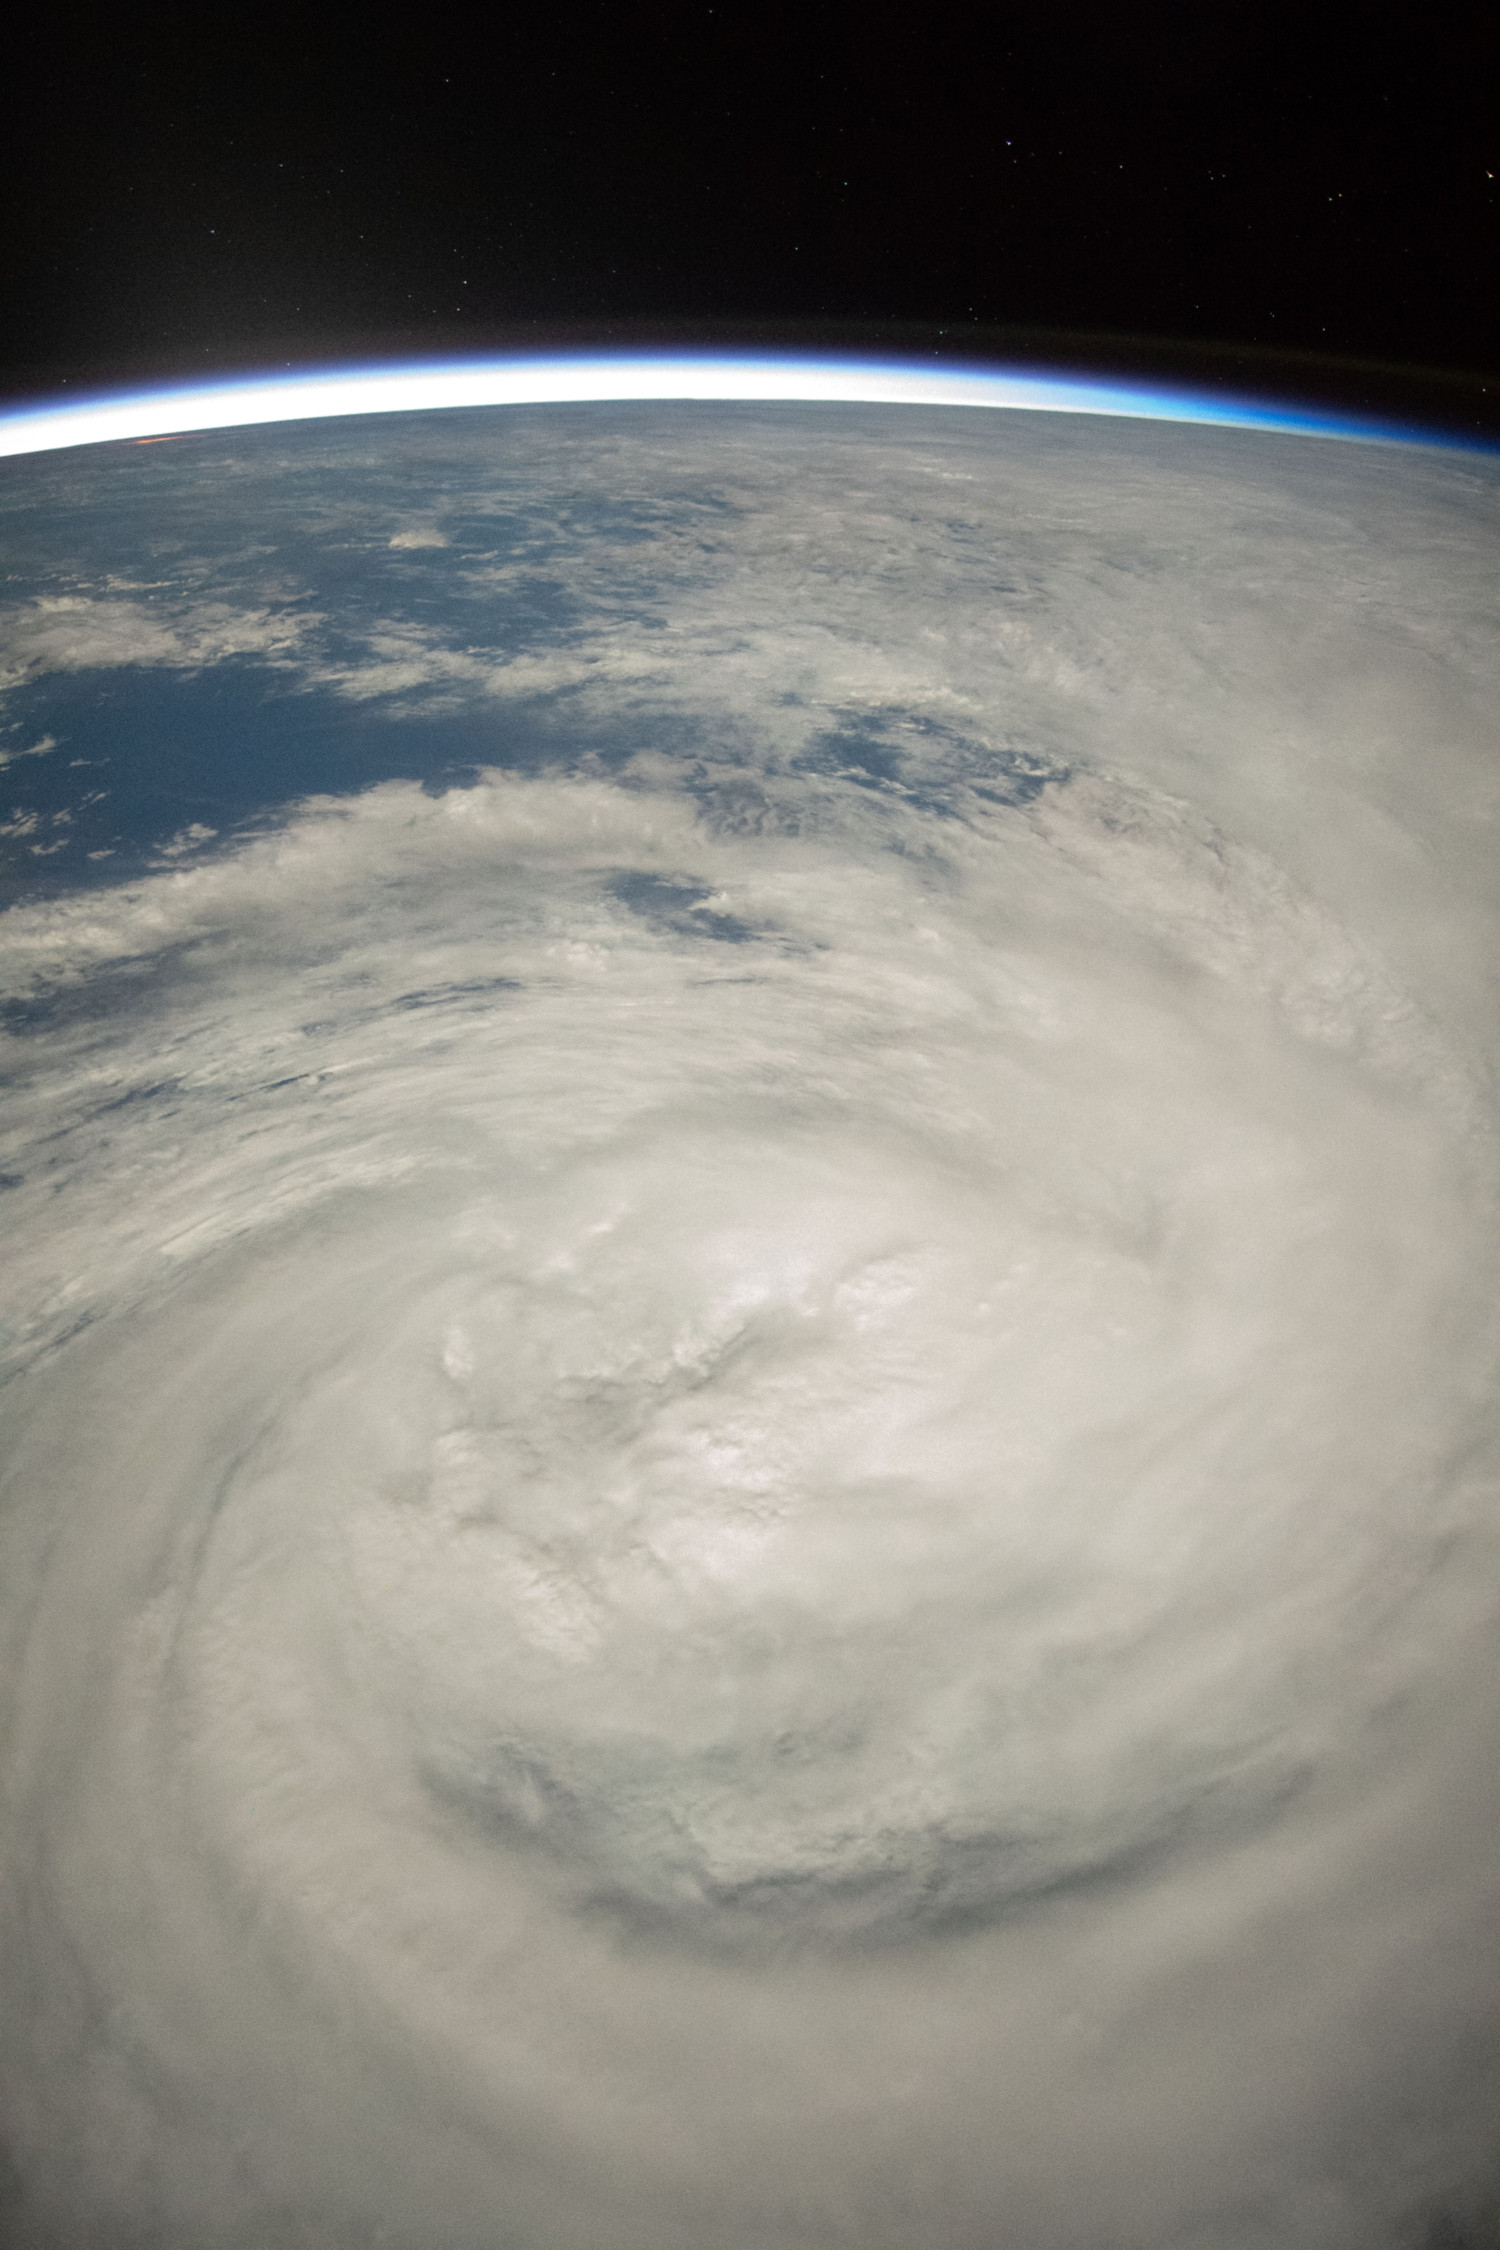
During the course of this five-year project, the CyMISS science team (which is now the TWA science team) amassed a large collection of storm images that we wish to share. During the last months of the CyMISS project, the science team was investigating a number of improvements to the observing techniques being employed. One of the investigations involved observing storms at night using moonlight as the source of illumination. On February 20, 2019, the Expedition 58 crew of ISS acquired a series of 240 image pairs of Tropical Cyclone Oma with the exposure times alternating between 1/30th and 1/8th of a second (see “ISS Daily Summary Report – 2/20/2019”). The image sequence spanned from 16:58:46 to 17:02:45 GMT when the Moon, which provided the only source of illumination for the storm, was about 25 hours past full. The estimated lunar V magnitude of -12.3 resulted in an illumination level of about 1.7X10⁻⁶ that of the Sun, all else being equal. At this time, Tropical Cyclone Oma was located at about 22.1° S, 160.6° E in the South Pacific off the east coast of Australia and was rated as a Category 2 storm on the Australian tropical cyclone intensity scale with sustained winds of about 105 kph (65 mph) – a strong “tropical storm” on the Saffir-Simpson scale used in North America. A sample image from that observation session is shown below.
In addition to assessing moonlit observations of weather, the CyMISS science team was also interested in investigating the visibility of stars above the horizon potentially to be used to refine the pointing knowledge of the camera. Such knowledge, along with details of the position of the ISS at the time, would allow the images to be geolocated more accurately as well as determine cloud top altitudes using stereography. A sample close up view of the sky is shown below. The stars are clearly visible across this swath of sky covering about 45° from just above the ecliptic plane in the constellation of Capricorn on the left towards the southern constellation of Grus on the right.
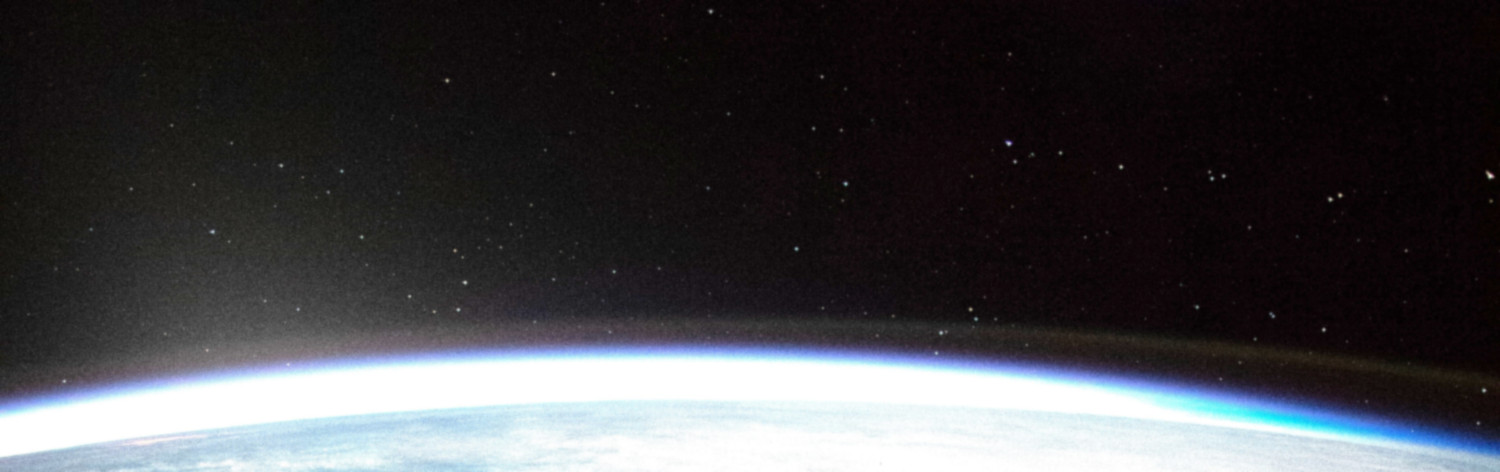
Also visible is the airglow layer just above the horizon at an altitude of about 90 kilometers. This layer is caused by sodium deposited by meteors which had burned up in Earth’s upper atmosphere and subsequently energized by solar radiation. The energized sodium atoms then shed this extra energy by D line emissions at wavelengths of 589 and 590 nm to produce its distinctive yellow color. On the left side of the image, the glow of zodiacal light (i.e. sunlight scattering off interplanetary dust concentrated along the ecliptic plane) is also evident above the bright horizon where light from the Sun (which was about 8° below the horizon of the ISS at this time) is scattering through the atmosphere. A detailed analysis revealed that stars with a V magnitude as faint at +7.5 are visible in the images with an exposure time of 1/8th of a second (for more details of this analysis, see “The South Pacific Nighttime Sky as Seen from the ISS”).
![]()
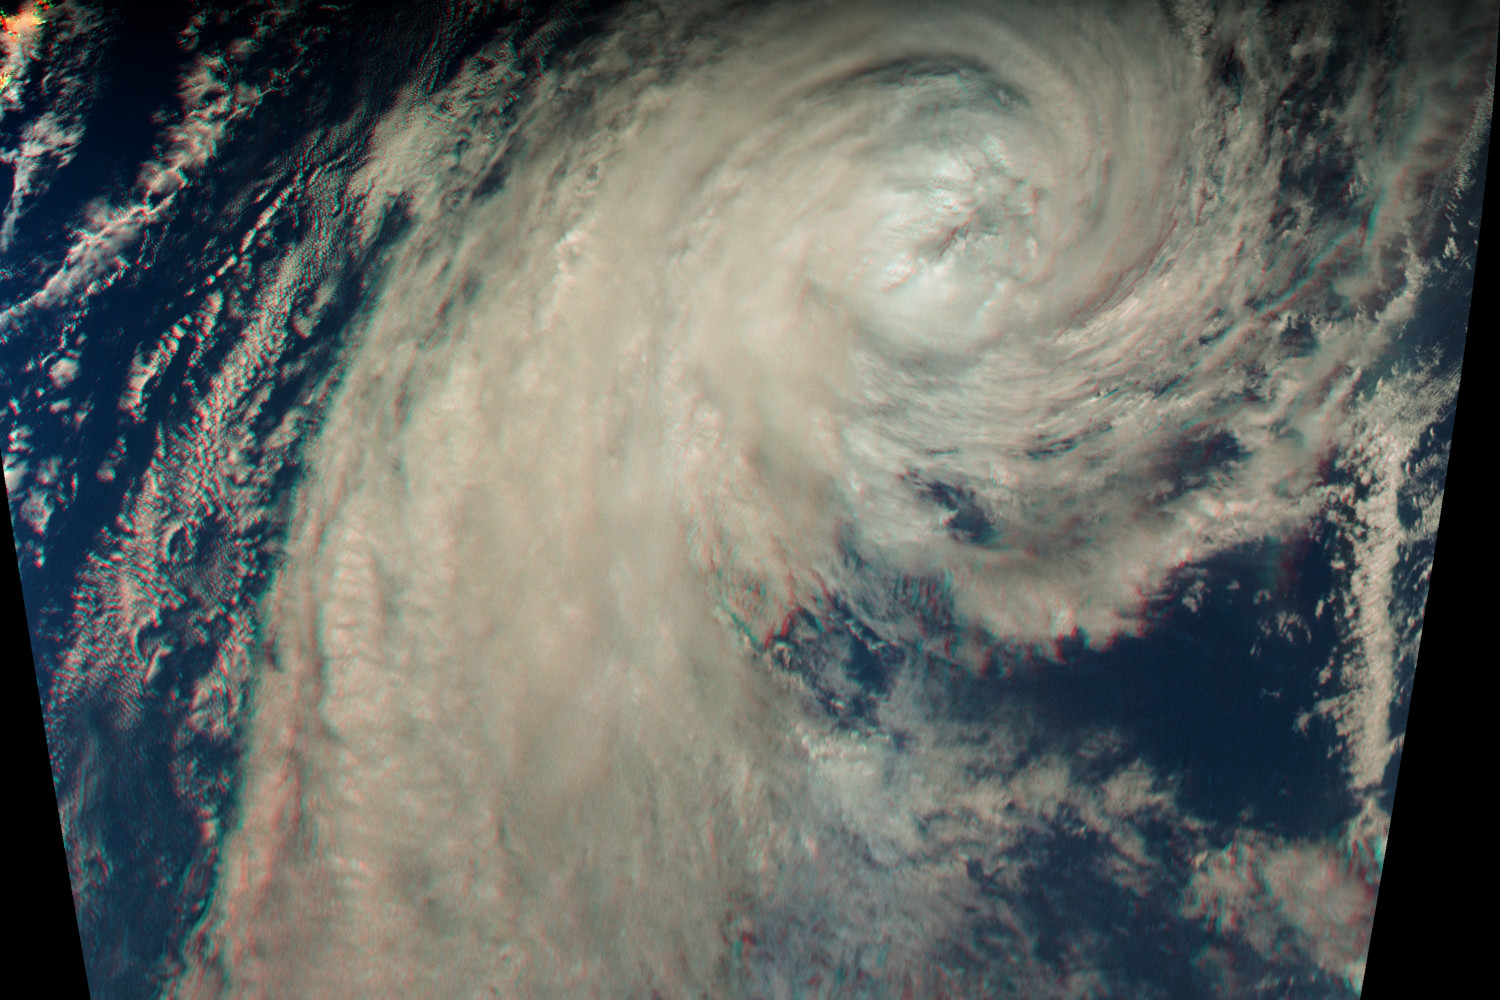
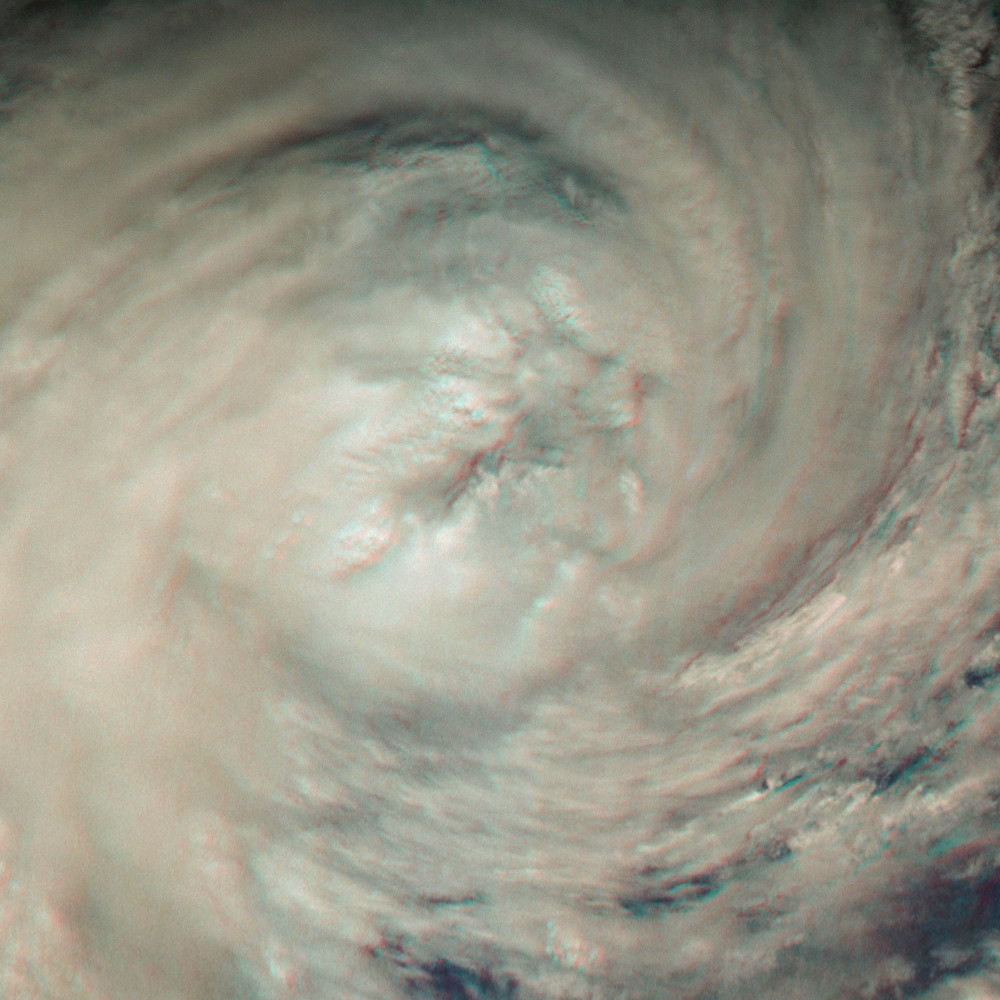
A synoptic 3D view created from the ISS photographs taken that night is shown above. In order to create the anaglyphic 3D image (left eye red, right eye blue), the individual photographs from the original image sequence were remapped to approximate an overhead view before various parts of the frames were stitched together into a synoptic 3D mosaic covering an area of approximately 1,500 by 1,000 kilometers at an image scale of 1,000 meters/pixel with the lights of Brisbane, Australia visible in the upper left corner. Note that this storm is rotating in a clockwise direction – the opposite direction to which we are accustomed to seeing in TCs in the northern hemisphere. Below is a higher-resolution, close up 3D view of the region near the eye of the storm with an image scale of 500 meters/pixel.
![]()
Related Reading
Andrew LePage, “The Hurricane Hunter Satellites”, Drew Ex Machina, May 15, 2022 [Post]
Drew LePage, “Using the Carnot Engine Model to Characterize Hurricanes from Orbit”, TWA Blog, July 23, 2022 [Post]
Drew LePage, “The Impact of New Satellite Wind Measurements on Hurricane & Tropical Cyclone Forecasting”, TWA Blog, January 15, 2023 [Post]
Paul Joss, “The Cyclone Intensity Measurements from the ISS (CyMISS)”, Space Station Research Explorer [Page]
Bill Keeter, “ISS Daily Summary Report – 2/20/2019”, ISS On-Orbit Status Report, February 20, 2019 [Post]
Andrew LePage, “The South Pacific Nighttime Sky as Seen from the ISS”, Drew Ex Machina, November 4, 2019 [Post]
