One of the precursor projects for Tropical Weather Analytics’ Hurricane Hunter Satellites was the CyMISS (Tropical Cyclone intensity Measurements from the ISS) project which ran from 2014 to 2019. Funded by a series of grants from CASIS (Center for the Advancement of Science in Space) which manages the ISS US National Laboratory for NASA, CyMISS was performed by the science team at Visidyne (the corporate antecedent of Tropical Weather Analytics) for NASA’s Tropical Cyclone Experiment as part of NASA’s CEO (Crew Earth Observations) activities on the International Space Station. The goal of CyMISS was to acquire image sequences of intense tropical cyclones (TCs), such as hurricanes and typhoons, from the ISS using a specially designed photography protocol (see “The Cyclone Intensity Measurements from the ISS (CyMISS)”) to support the development of stereographic imaging techniques of these destructive storms. These techniques will allow the altitudes of the cloud tops near the eye of TCs to be precisely determined so that these TCs can be more accurately characterized compared to existing remote sensing methods (see “Using the Carnot Engine Model to Characterize Hurricanes from Orbit”).
During the course of this five-year project, the CyMISS project science team (which is now the core of the TWA science team) amassed a large collection of storm images that we wish to share. One of the TCs observed in support of CyMISS by the crew of ISS Expedition 50 was the powerful, late-season Pacific storm, Typhoon Nock-ten (also known as Typhoon Nina in the Philippines), observed on December 24, 2016.
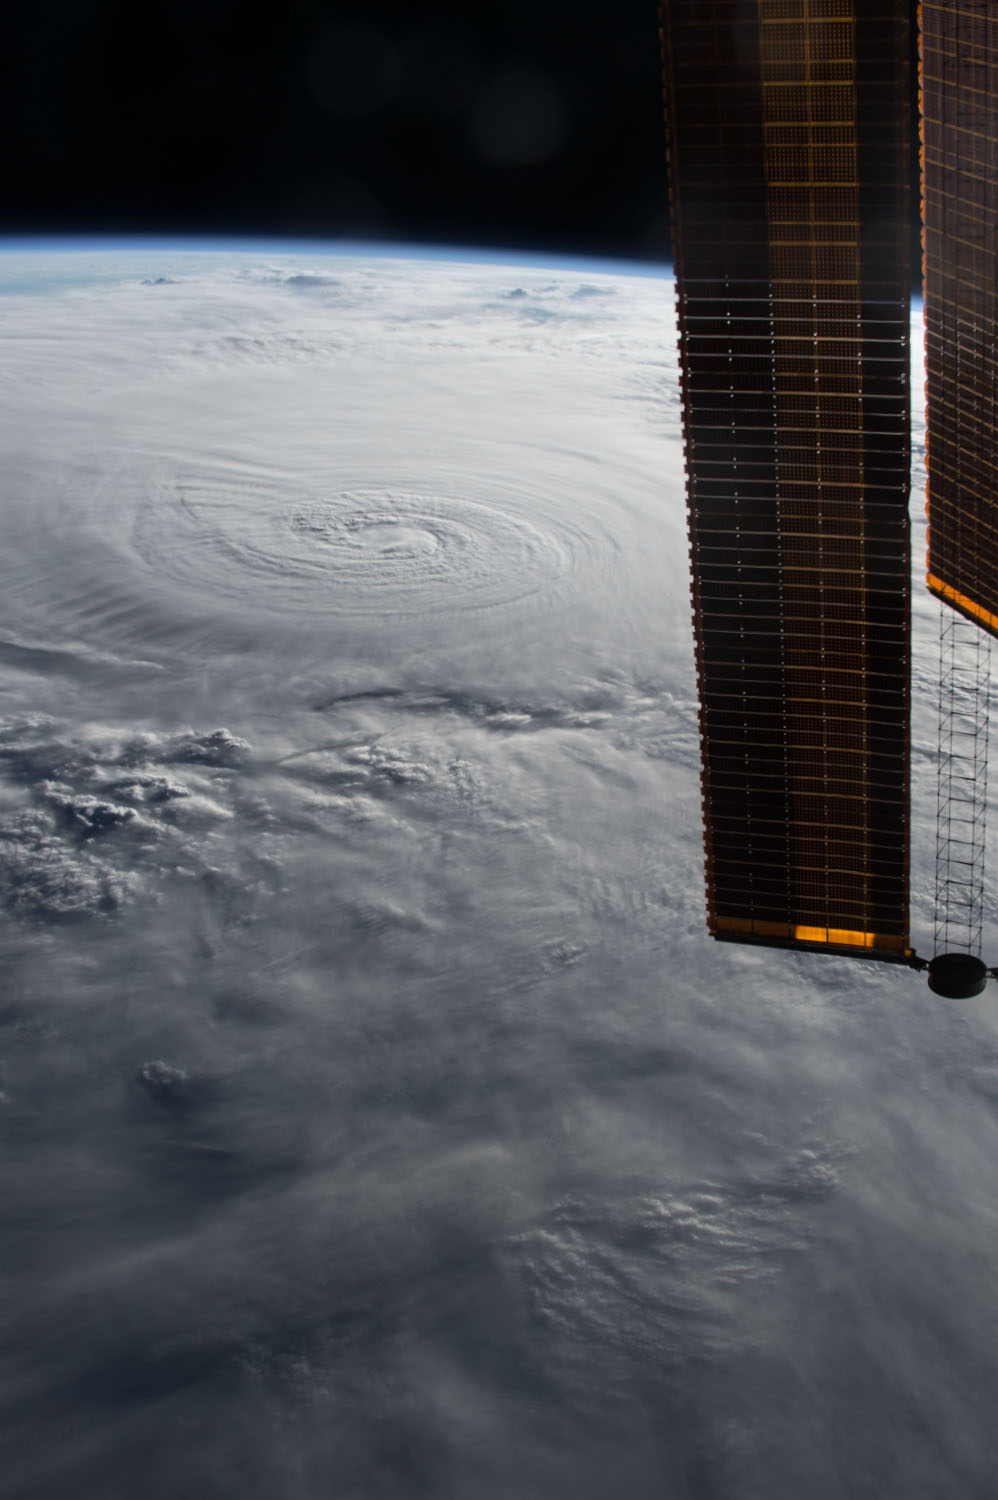
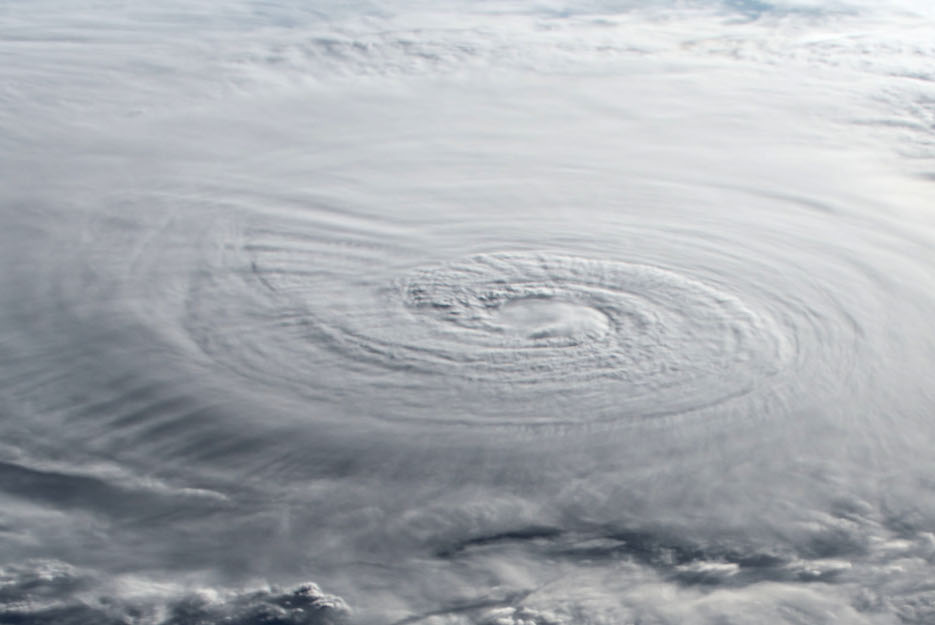
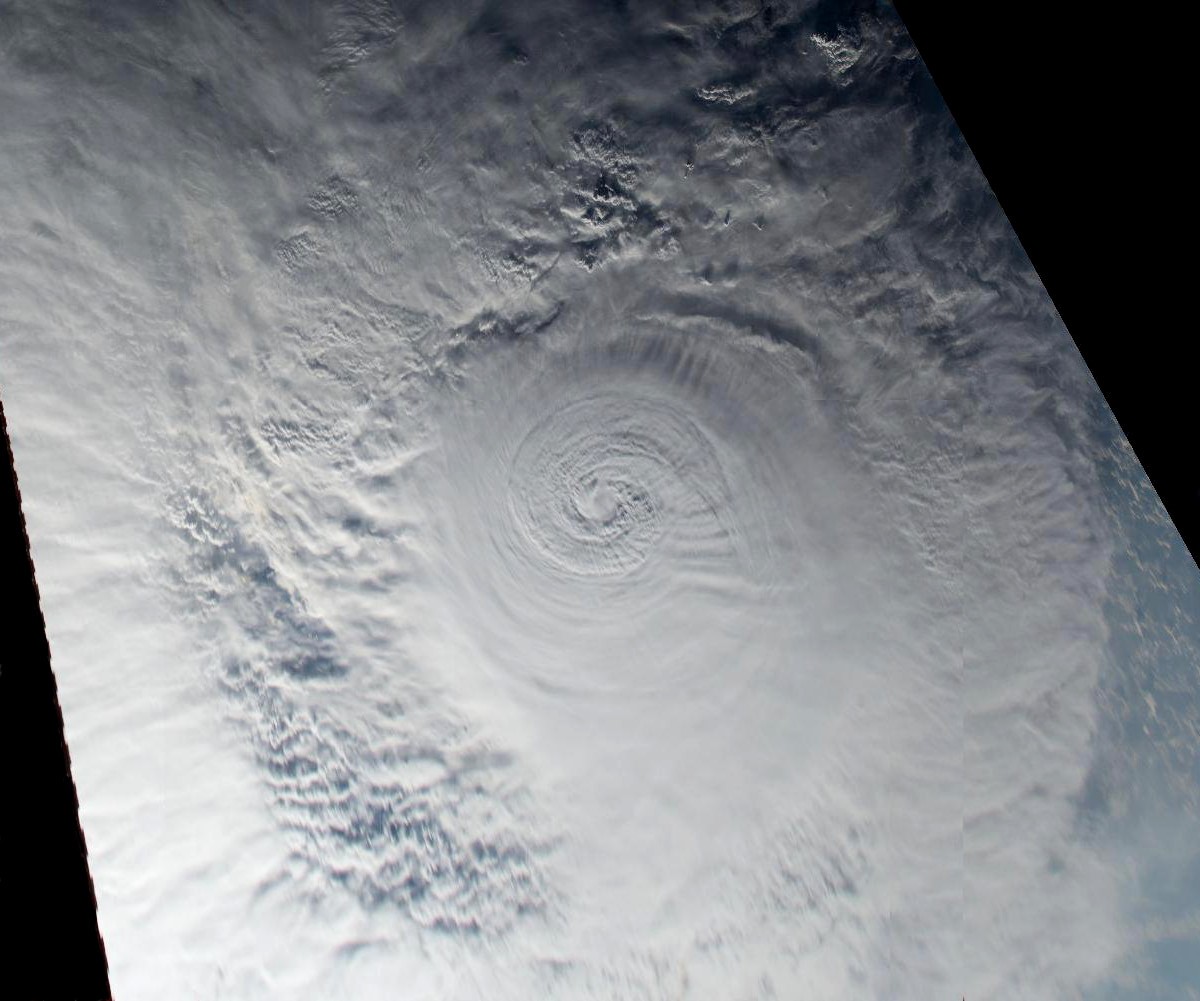
A total of 240 photographs, like the example shown above, were acquired by the crew of Expedition 50 during a four-minute observation session which started at 08:28:00 GMT as Typhoon Nock-ten was approaching the central Philippines. At 06:00 GMT on December 24 (2½ hours before our observations), Typhoon Nock-ten reached its peak intensity with estimated ten-minute maximum sustained winds of 195 kph (120 mph) making it a strong Category 3 storm on the Saffir-Simpson scale. With a central pressure of 915 hPa, Typhoon Nock-ten was the latest-forming typhoon of such intensity or stronger on record. A synoptic 2D color view created from a subset of the ISS photographs taken that day is shown below. In order to create this mosaic, the individual photographs from the original image sequence were remapped to approximate an overhead view before the frames were stitched together into a synoptic view covering an area of approximately 1,200 by 1,000 kilometers. A high-resolution version of this 2D mosaic with an image scale of ~1,000 meters/pixel can be viewed by clicking on the image below.
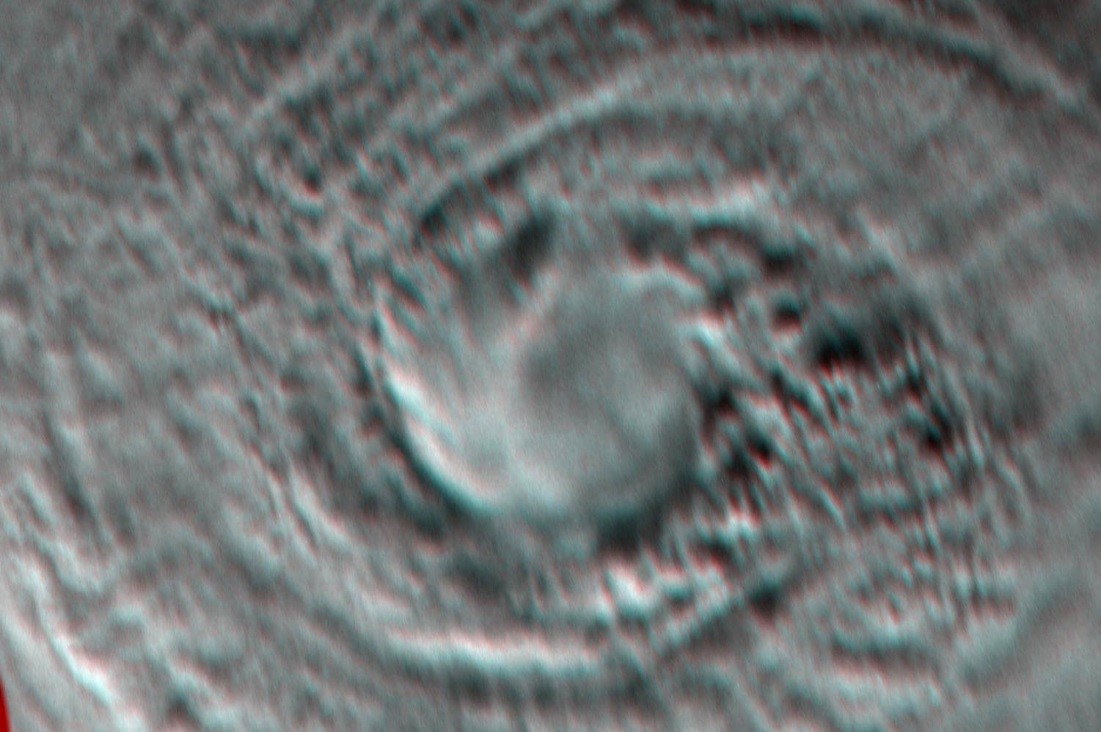
The close-up 3D image shown below was created using a pair of photographs of the 50-kilometer eye of Typhoon Nock-ten taken a few seconds apart around 08:29 GMT. Only the red channel of the original color images was used in order to cut through any atmospheric haze and maximize the visibility of the cloud features. These images were remapped to approximate an overhead view before being combined to create an anaglyphic 3D image. The resulting stereo view, which can be seen at full size with a scale of about 140 meters/pixel by clicking on the image below, covers an area of 150 by 100 kilometers. At this point in the storm’s development, the eye had filled in with clouds but would clear later in the day.
![]()
Related Reading
Drew LePage, “The Hurricane Hunter Satellites”, Drew Ex Machina, May 15, 2022 [Post]
Drew LePage, “Using the Carnot Engine Model to Characterize Hurricanes from Orbit”, TWA Blog, July 23, 2022 [Post]
Drew LePage, “Turn Up the Stereo”, TWA Blog, March 3, 2022 [Post]
Paul Joss, “The Cyclone Intensity Measurements from the ISS (CyMISS)”, Space Station Research Explorer [Page]

Thank you, I have just been searching for information approximately this topic for a while and yours is the best I have found out so far. However, what in regards to the bottom line? Are you certain concerning the supply?