One of the precursor projects for Tropical Weather Analytics’ Hurricane Hunter Satellites was the CyMISS (Tropical Cyclone intensity Measurements from the ISS) project which ran from 2014 to 2019. Funded by a series of grants from CASIS (Center for the Advancement of Science in Space) which manages the ISS US National Laboratory for NASA, CyMISS was performed by the science team at Visidyne (the corporate antecedent of Tropical Weather Analytics) for NASA’s Tropical Cyclone Experiment as part of NASA’s CEO (Crew Earth Observations) activities on the International Space Station. The goal of CyMISS was to acquire image sequences of intense tropical cyclones (TCs), such as hurricanes and typhoons, from the ISS using a specially designed photography protocol (see “The Cyclone Intensity Measurements from the ISS (CyMISS)”) to support the development of stereographic imaging techniques of these destructive storms. These techniques will allow the altitudes of the cloud tops near the eye of TCs to be precisely determined so that these TCs can be more accurately characterized compared to existing remote sensing methods (see “Using the Carnot Engine Model to Characterize Hurricanes from Orbit”)
During the course of this five-year project, the CyMISS science team (which is now the TWA science team) amassed a large collection of storm images that we wish to share. One of the TCs observed in support of CyMISS by the crew of ISS Expedition 56 in 2018 was the Pacific storm, Hurricane Hector, as it brushed the Hawaiian Islands.
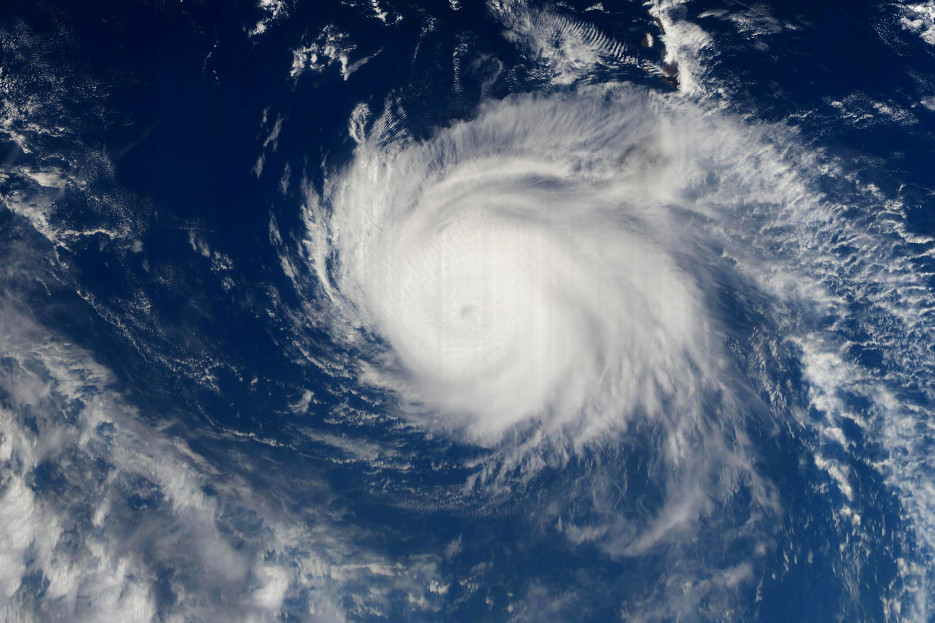
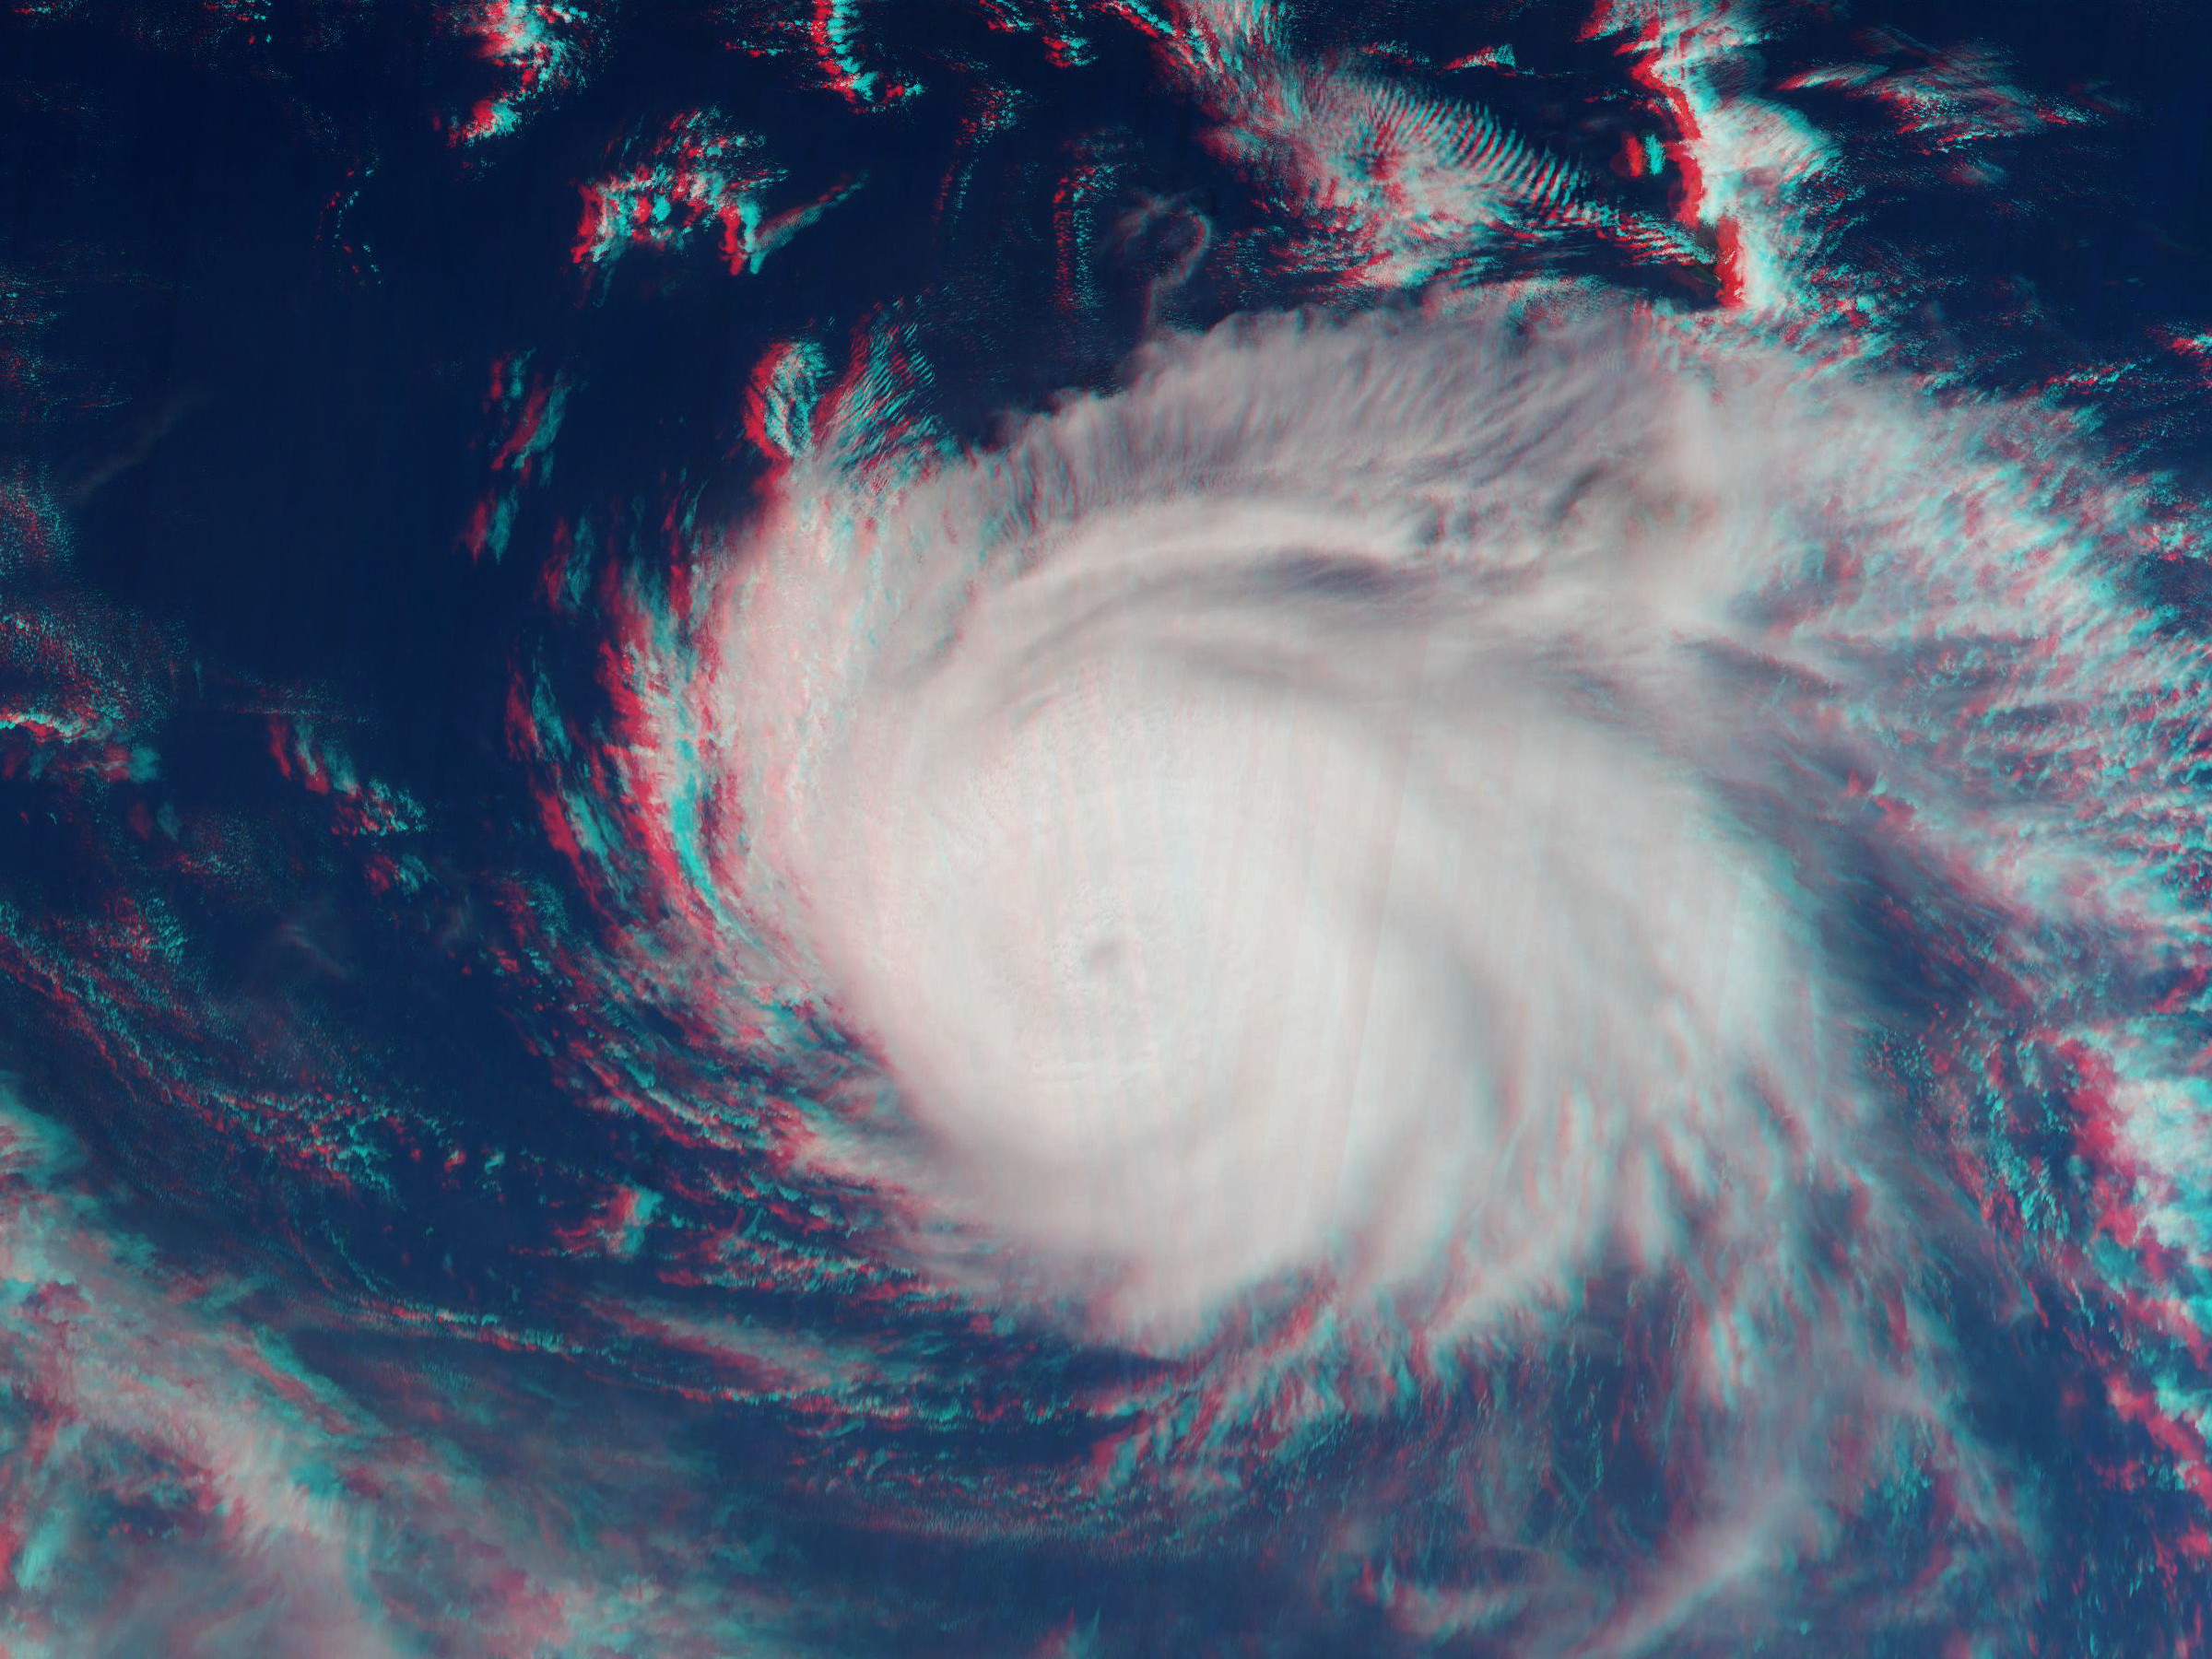
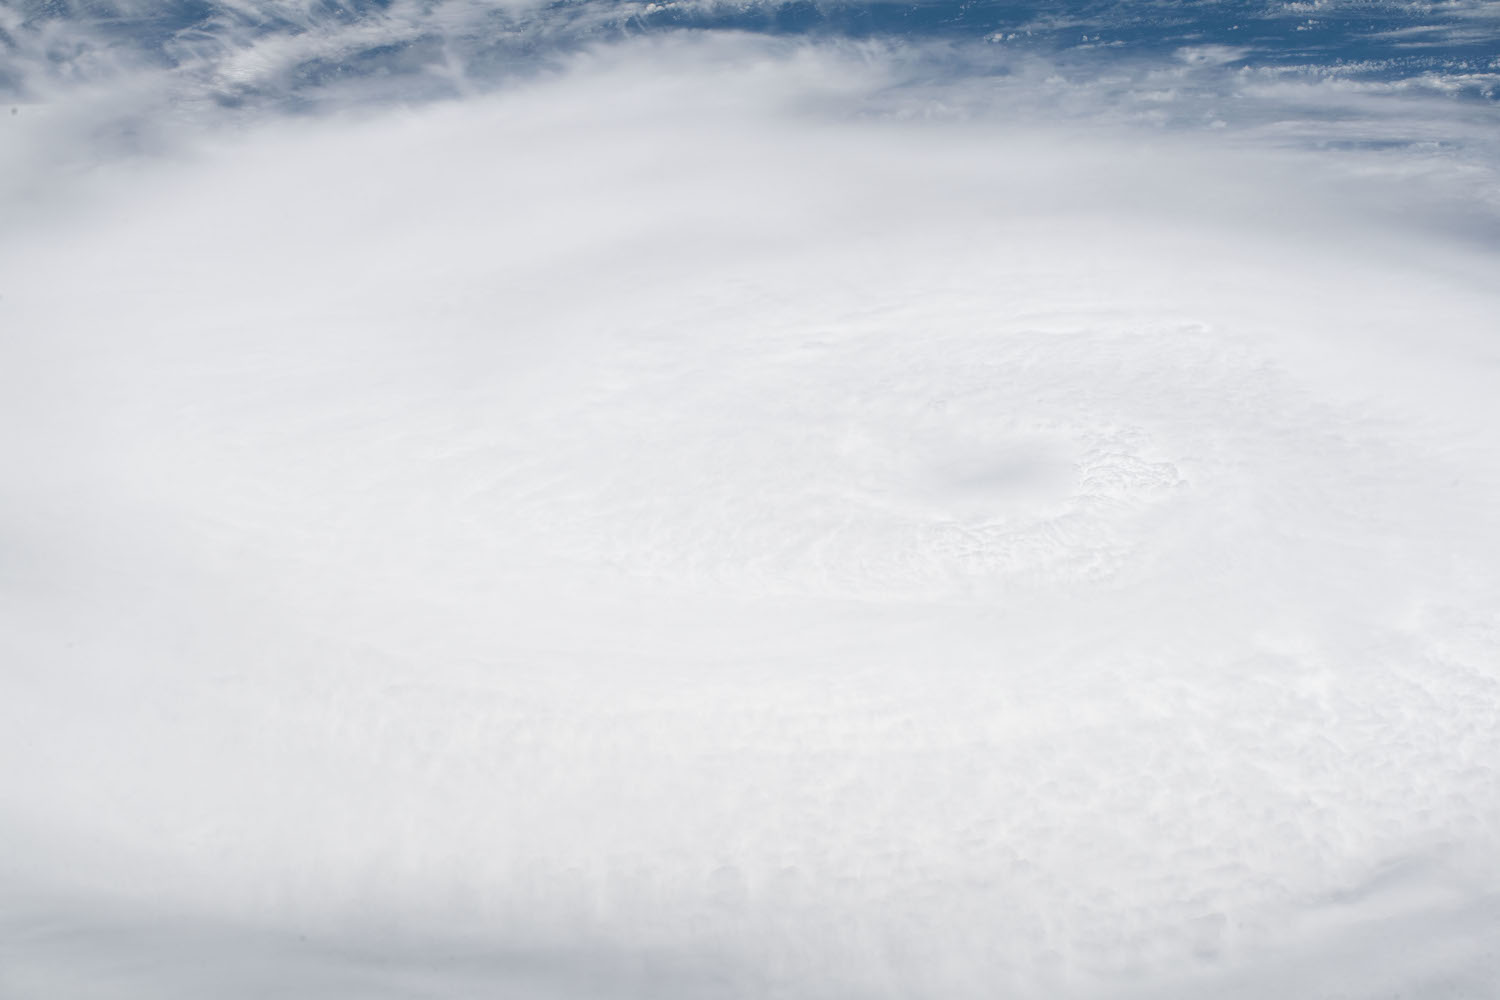
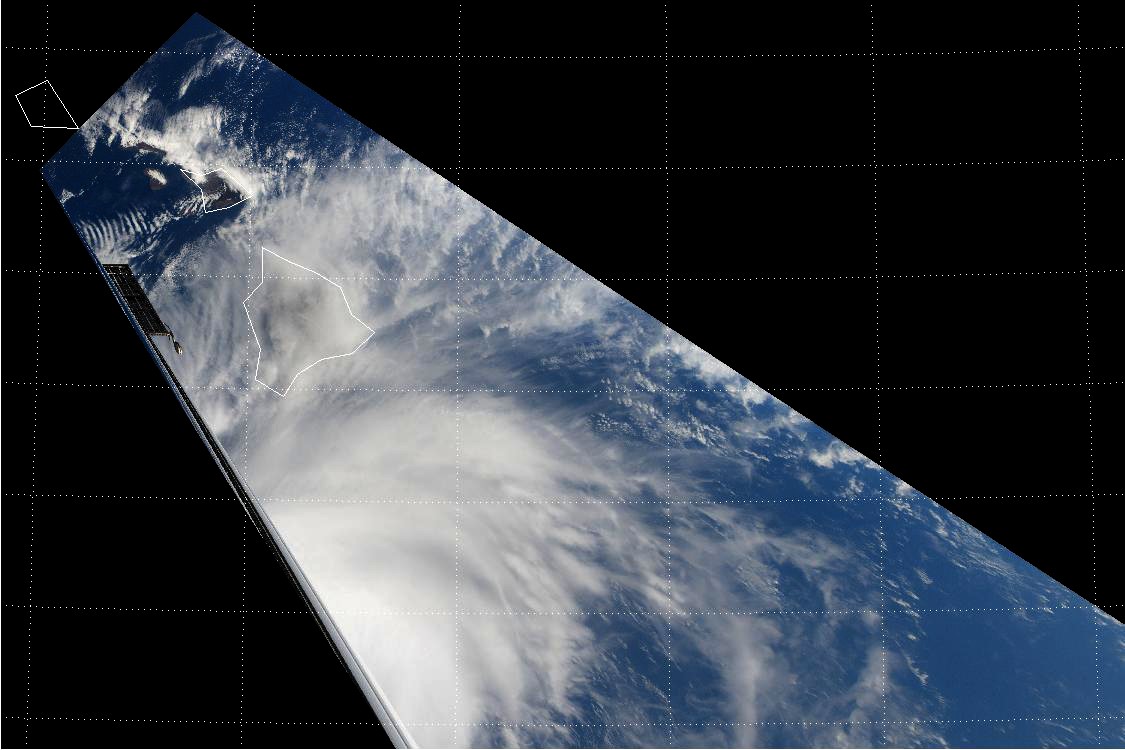
Stereo views of Hurricane Hector were created using images from a sequence of 240 photographs, like the one shown above, taken by the crew of the ISS during an overpass on August 8, 2018 (see “ISS Daily Summary Report – 8/08/2018”). When the four-minute photography session started at 22:29:01 GMT, Hector was located at about 16.6° N, 155.7° W in the Pacific Ocean about 360 kilometers south of Hawaii. The weakening hurricane was rated as a Category 3 storm with sustained winds of about 185 kph (115 mph). While storms of this strength frequently stretch well over 1,000 kilometers, Hurricane Hector was a fairly compact tropical cyclone about 650 kilometers across. In order to create a wide-area anaglyphic 3D image (left eye red, right eye blue), the individual photographs from the original image sequence were remapped to approximate an overhead view before various parts of the frames were stitched together into a synoptic 3D mosaic covering an area of approximately 1,200 by 900 kilometers. A high resolution version of this synoptic 3D mosaic with an image scale of 500 meters/pixel can be viewed by clicking on the image below. The Hawaiian Islands are visible at the top of the image just to the right of center. The clouds of Hurricane Hector stand far above those not associated with the storm.
![]()
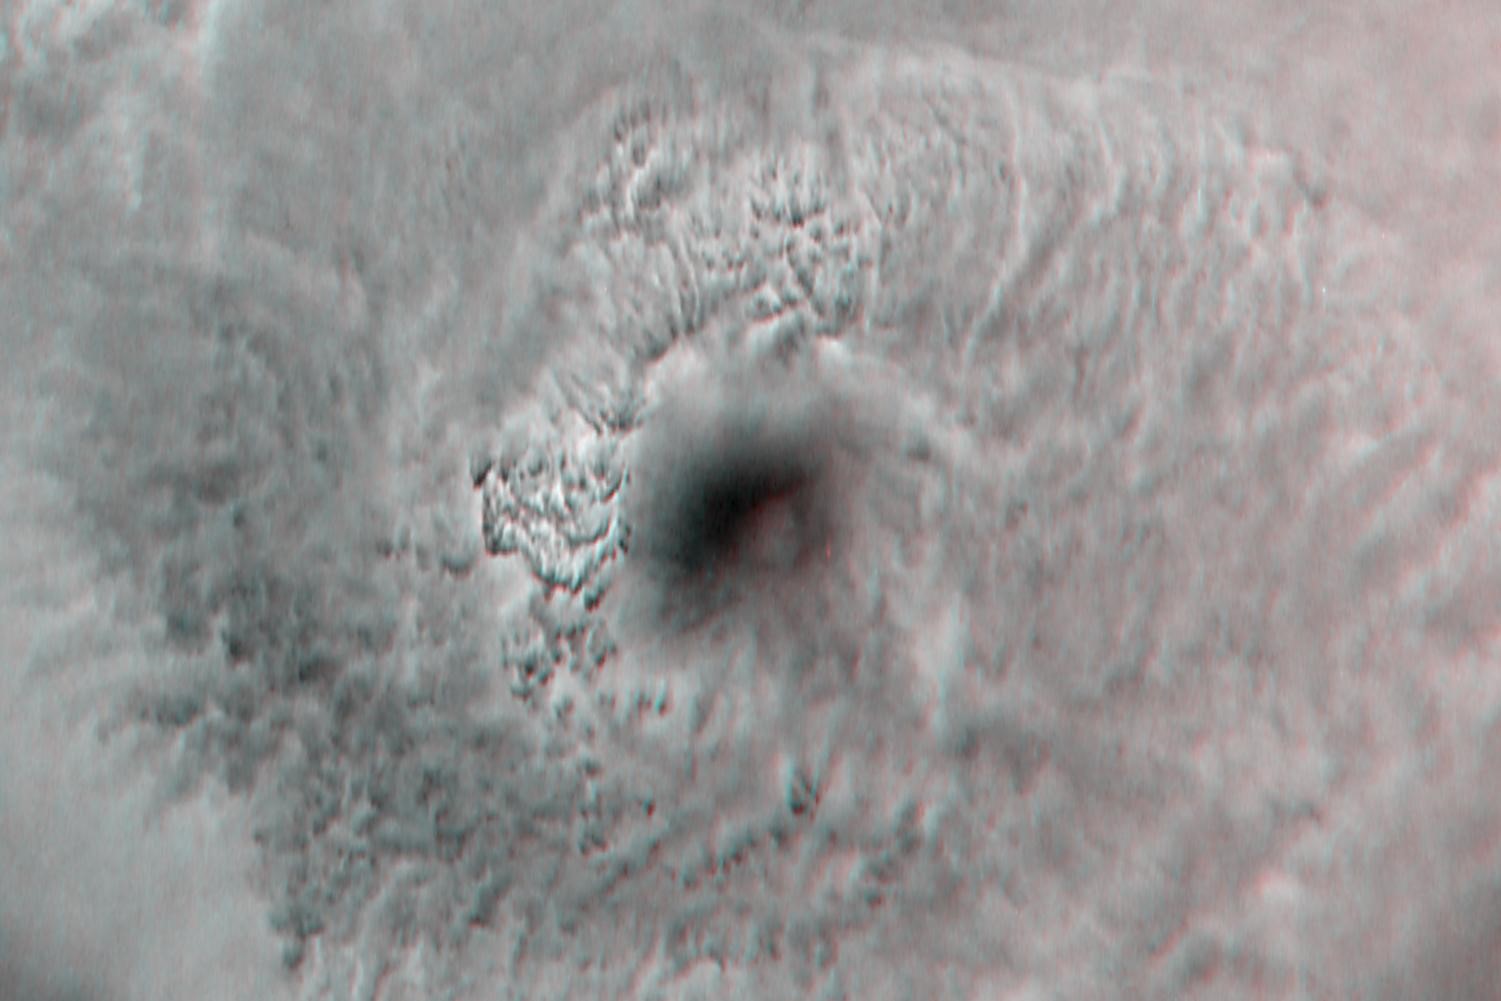
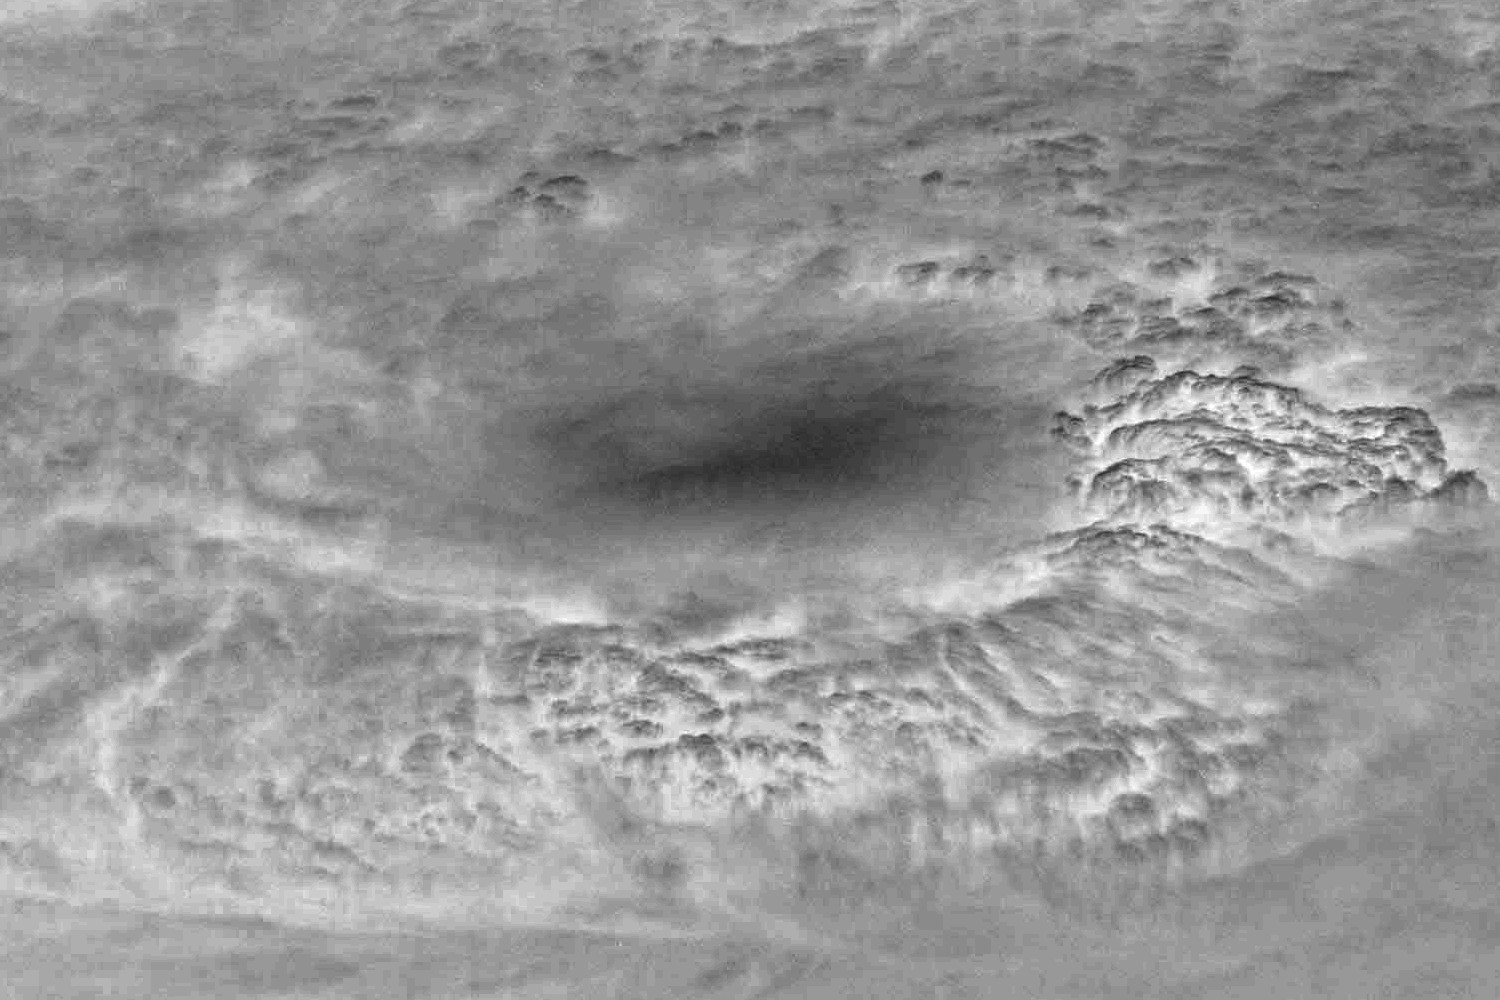
While the eye of this storm looks quite subdued, there is actually much structure present in an enhanced, closeup view. A closeup 3D image was created using a pair of raw, 12-bit/color-plane images of the 30-kilometer eye of Hurricane Hector taken a few seconds apart around 22:30:54 GMT. Only the red channel of the original color images was used in order to cut through any atmospheric haze and maximize the visibility of the cloud features. These images were remapped to approximate an overhead view and had their contrast stretched before being combined to create an anaglyphic 3D image. The resulting 3D image, which can be viewed at full size of 100 meters/pixel by clicking on the image below, covers an area of 150 by 100 kilometers.
![]()
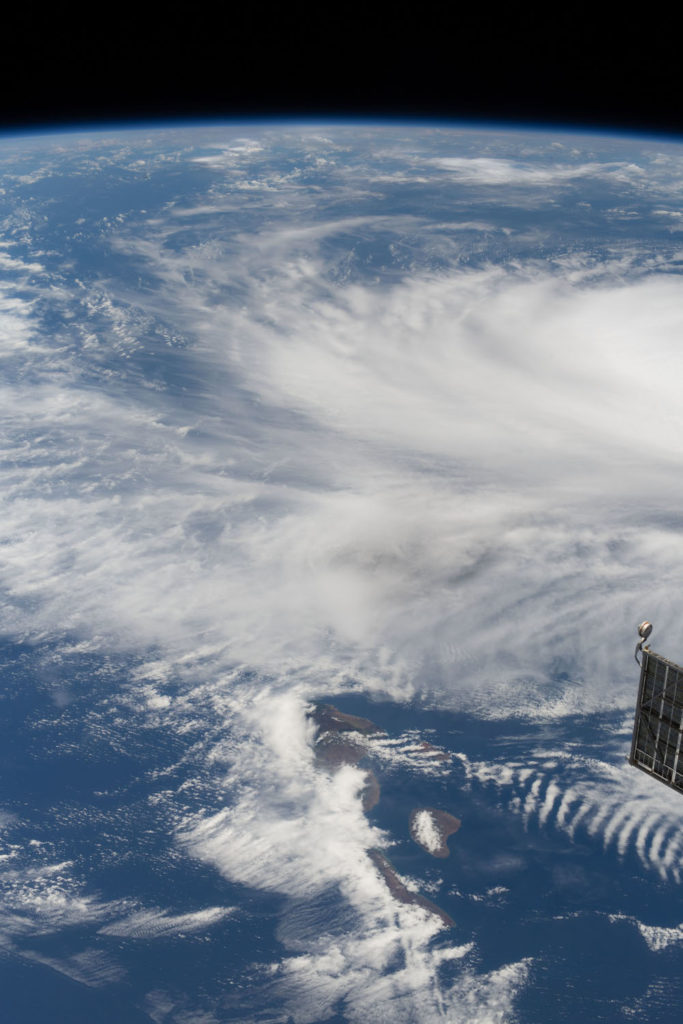
In addition to the image sequence acquired using our photography protocol, supplementary images were also taken by the ISS crew using a handheld camera fitted with a 170 mm telephoto lens. These individual views had 3.4X the resolution of the normal CyMISS image sequences acquired with a shorter focal length 50 mm lens. Although 3D views could not be created using these images, they did provide important information about the scene structure around the eyes of TCs. In the original, unprocessed version of the color image shown below, ISS056-E-130378, the details in the region of the eye of Hurricane Hector appear rather subdued.
But by enhancing the contrast of the original raw, 12-bit/color plane image, rich detail is revealed as shown in the processed closeup of the eye at the bottom. This closeup, with an image scale of 40 meters/pixel, uses just the red channel with a magnification of about 4X of the original with the contrast stretched 8X. The use of modern digital cameras with 12-bit dynamic range should reveal sufficient detail for automated stereo processing software to provide accurate measurements of cloud top altitudes near the eye of TCs.
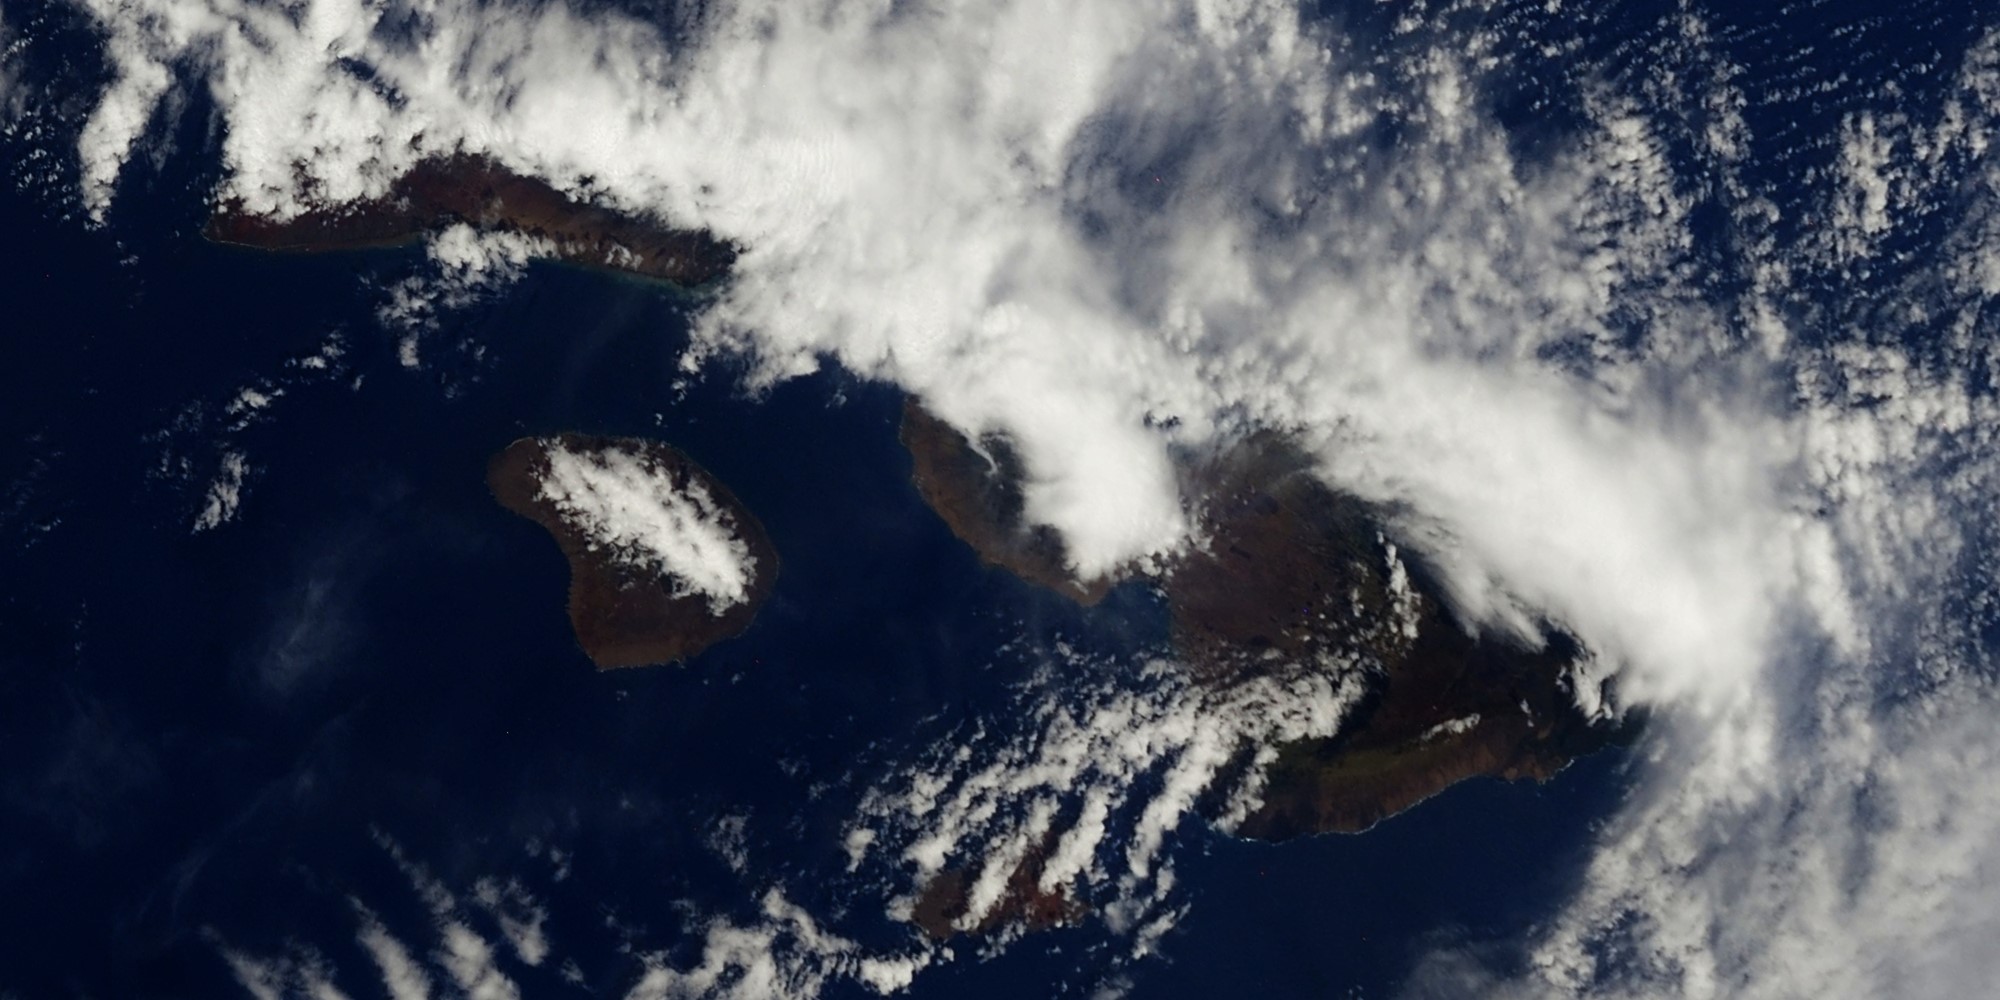
One of the important new issues the CyMISS science team started investigating in 2018 was how to improve the geolocation of the images being acquired by the crews of the ISS. With the clear view of the Hawaiian Islands, with their precisely located landmarks, this observation session of Hurricane Hector provided the team with its second opportunity to investigate image geolocation.
One important source of geolocation error was the difference between the indicated time on the Nikon D5 cameras and the actual GMT of the observations. An earlier investigation had suggested that this difference could be as much as a couple of tens of seconds. With the ISS travelling at a speed of 7 kilometers per second, that issue alone could amount to an offset of over one hundred kilometers. After much wrangling between the CyMISS science team and the ISS support staff at NASA’s Johnson Space Center and Marshall Space Flight Center trying to come up with a high-tech solution to synchronize the cameras with the ISS time base using the equipment available on the station, we eventually adopted an “old-school” solution: before each observation session, use the camera to take a series images of a computer screen displaying the ISS time. Comparing the time on the display with the time the camera stamped on the image file, we could determine an accurate time offset.
For this geolocation exercise, we found a -17.094±0.013 second offset between the camera indicated time and the displayed ISS time using our new synchronization procedure. We had been informed that the ISS time base was synchronized with GPS time which differs from GMT (upon which our ISS orbit ephemeris was based) by 7 seconds amounting to a 50-kilometer offset in the position of the ISS. Our geolocation exercise with Hawaii confirmed the results of an earlier investigation that this was not the case – the time being displayed on the ISS computer screen was in fact GMT and not GPS time. With this issue resolved, we were able to geolocate our images to an accuracy of about six kilometers with this offset being primarily along the ground track of the ISS. This offset was consistent with the accuracy of the ephemeris being used to predict the space station’s position.
Related Reading
Drew LePage, “The Hurricane Hunter Satellites”, Drew Ex Machina, May 15, 2022 [Post]
Drew LePage, “Using the Carnot Engine Model to Characterize Hurricanes from Orbit”, TWA Blog, July 23, 2022 [Post]
Drew LePage, “Turn Up the Stereo”, TWA Blog, March 3, 2022 [Post]
Paul Joss, “The Cyclone Intensity Measurements from the ISS (CyMISS)”, Space Station Research Explorer [Page]
