While the 2022 Atlantic hurricane season saw only a slightly above average number of storms, it still turned out to be the third costliest on record with over 300 lives lost and an estimated $118 billion in property losses. By far the most damaging of these storms was Hurricane Ian which made landfall on the Florida Gulf coast at about 20:35 GMT (4:35 PM EDT) on September 28 after it had raged across the Caribbean and passed over the western tip of Cuba. Reaching a peak intensity earlier that day at about 12:00 GMT (8:00 AM EDT), Hurricane Ian packed sustained winds of about 160 mph (72 m/s) making it a Category 5 hurricane on the Saffir-Simpson scale. Hurricane Ian caused an estimated $113 billion in total damage making it the third most costly hurricane after Hurricane Katrina in 2005 and Hurricane Harvey in 2017, which each caused an estimated $125 billion in damage.
While the third most costly, Hurricane Ian was the costliest on record to hit Florida with almost $110 billion in damages and the loss of 66 lives as a direct result of the storm. While the high winds from Hurricane Ian were responsible for some of the losses, much of the destruction and loss of life was the result of the storm’s other effects. The 10 to 15-foot (3.0 to 4.6-meter) storm surge from Ian as its eye made landfall caused 41 fatalities, mainly in Lee County on the Gulf coast. Another important source of damage was from intense rainfall which dropped 10 to 20+ inches (25 to 50+ cm) of rain across central and eastern Florida. The resulting fresh water flooding accounted for another dozen direct fatalities. To add insult to injury, the severe weather associated with the outer rain bands of Hurricane Ian spawned 14 tornadoes across Florida on September 27 and 28.

Among the problems with Hurricane Ian as it approached the Florida coast were uncertainties in its strength and predictions of exactly where it would make landfall. Compounding these issues was what proved to be inadequate means of conveying threat information to local authorities so that they could initiate evacuations and other storm preparations (see “Hurricane Ian demonstrated the need to improve both the hurricane forecast and the messaging”). While data gathered from surface, air and space-based assets certainly provided much data about Hurricane Ian, still more data were needed by meteorologists and weather modelers to improve the accuracy of the storm’s forecast and better predict its effects on a local level.

The Hurricane Hunter Satellites (HHSat)
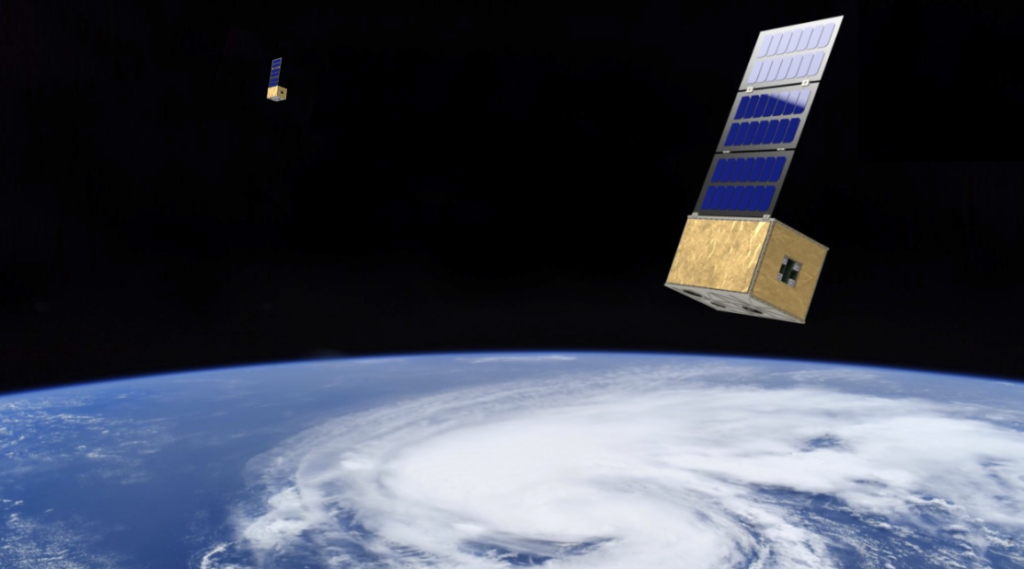
The Boston-based Tropical Weather Analytics (TWA), working in partnership with the Montreal-based Canada Weather Analytics (CWA), are currently working on the Orbital Weather Warning System (OWWS) to provide wind and other data to help improve weather forecasting including that of hurricanes. The first elements of the OWWS are the Hurricane Hunter Satellites (HHSats) being developed by TWA (see “The Hurricane Hunter Satellites”). The initial constellation of five satellite-pairs will use 12U CubeSats in 500-kilometer, Sun synchronous orbits fitted with an array of three visible cameras to provide wide-area, daytime stereographic imagery with a pixel scale of about 100 meters at nadir. In addition to generating visible band 2D cloud imagery with a resolution superior to that from NOAA’s JPSS and GOES weather satellites, HHSat will provide unique 3D cloud imagery to aid weather analysts. The first pair of HHSats is to be built by Phantom Space Corporation which will launch the satellites in 2025 and operate them during their planned five-year lifetime.
The unique high-resolution stereographic imagery produced by HHSat will be used to measure the altitudes of sub-kilometer size cloud features in a scene to an accuracy as good as ±100 meters. By analyzing the motions of these clouds through a sequence of stereo images, the wind speeds at those altitudes can be measured to an accuracy approaching 1 m/s using a technique analogous to that currently used for the GOES Derived Wind Motion data product. But unlike the GOES wind data product, the HHSat will be capable of measuring not only horizontal winds but also the vertical component of the wind. In a typical 2,000×2,000-kilometer scene (the minimum design requirement for the swath size), HHSat data can potentially provide hundreds of thousands of 3D wind measurements with better spatial resolution, measurement accuracy, and far superior altitude accuracy than the GOES Derived Motion Winds data product. And with the orbital planes of the five satellite pairs evenly spaced around the globe, the HHSat constellation can make repeated observations of any given target throughout the day. This is in contrast to NOAA’s existing JPSS polar orbiting constellation whose satellites’ orbital planes are clustered to make overpasses in the early morning and early afternoon hours.
As part of the TWA Science Team’s ongoing assessment of the utility of the HHSat constellation in weather forecasting, they have performed a case study of Hurricane Ian to determine what observations would have been made and when as well as the additional data it could have provided to help improve not only the characterization of the hurricane, but also the forecasting its future track and intensity.
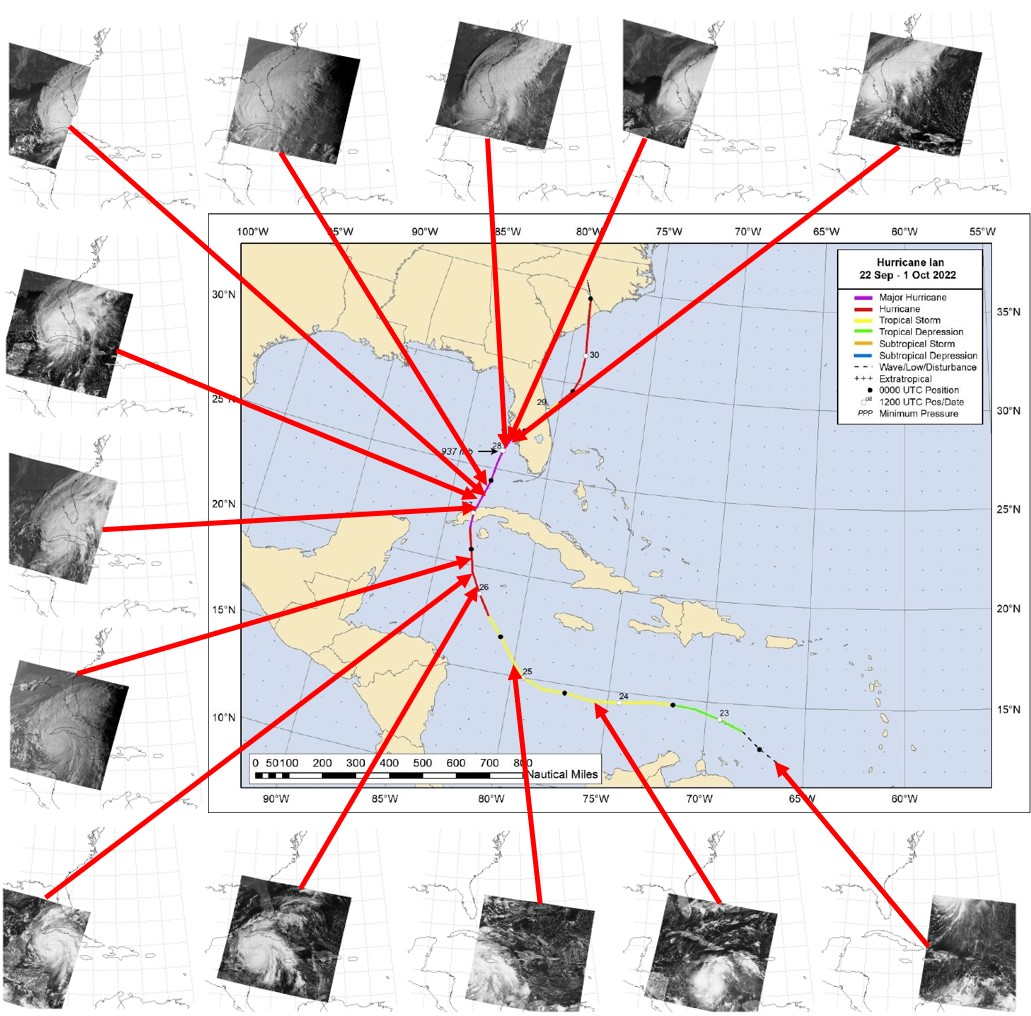
The illustration above shows a notional observation strategy by the HHSat constellation from September 22 to 28, 2022 with simulated HHSat images created using GOES ABI Band 2 imagery (a close approximation of the HHSat camera save for the much-reduced pixel scale). Initially, the precursor of Hurricane Ian would have been tracked almost daily as it moved across the Atlantic Ocean and into the Caribbean Sea by a pair of HHSats assigned to make regular observations across the tropics. By the time Ian reached hurricane strength on September 26, the cadence of observations would have increased to three then four times a day by diverting observations from the other HHSat satellite pairs from their normal surveys further to the north. What follows is a deep dive into the images and other data HHSat could have provided during a notional observation session at 15:40 GMT (11:40 AM EDT) on September 28, 2022 when Ian was still about five hours from making landfall and much uncertainty remained about its strength and track.
High-Resolution 2D Imagery
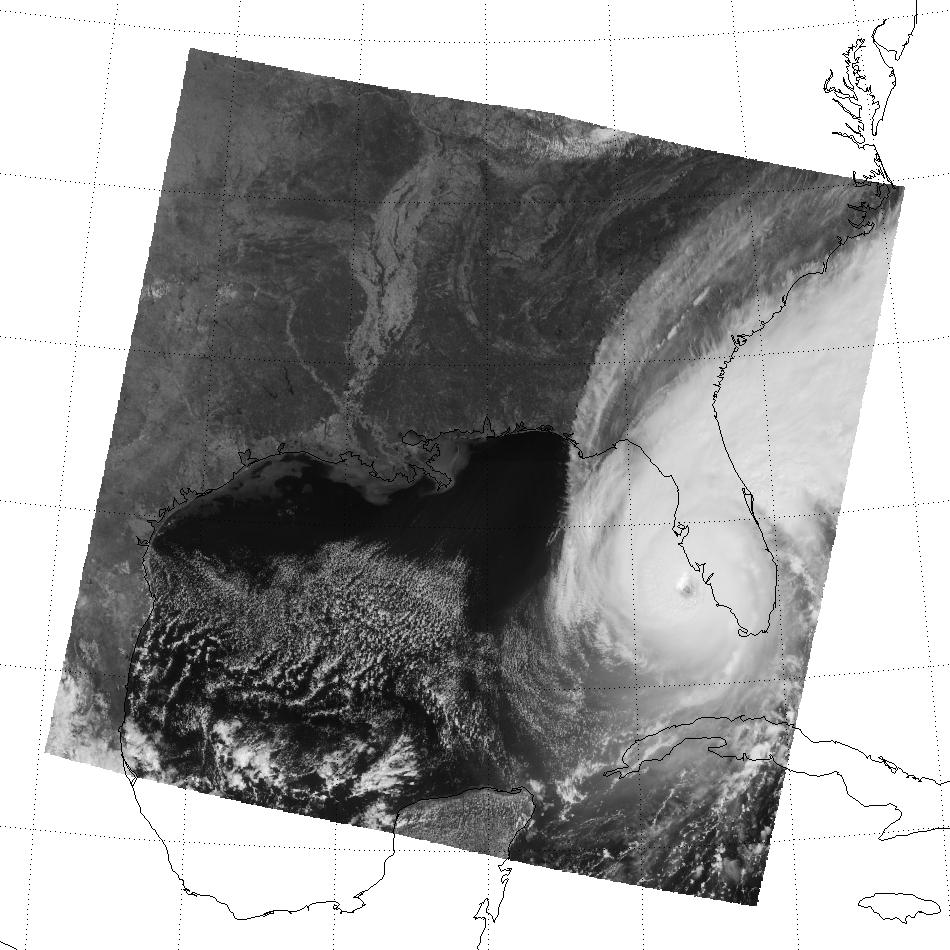
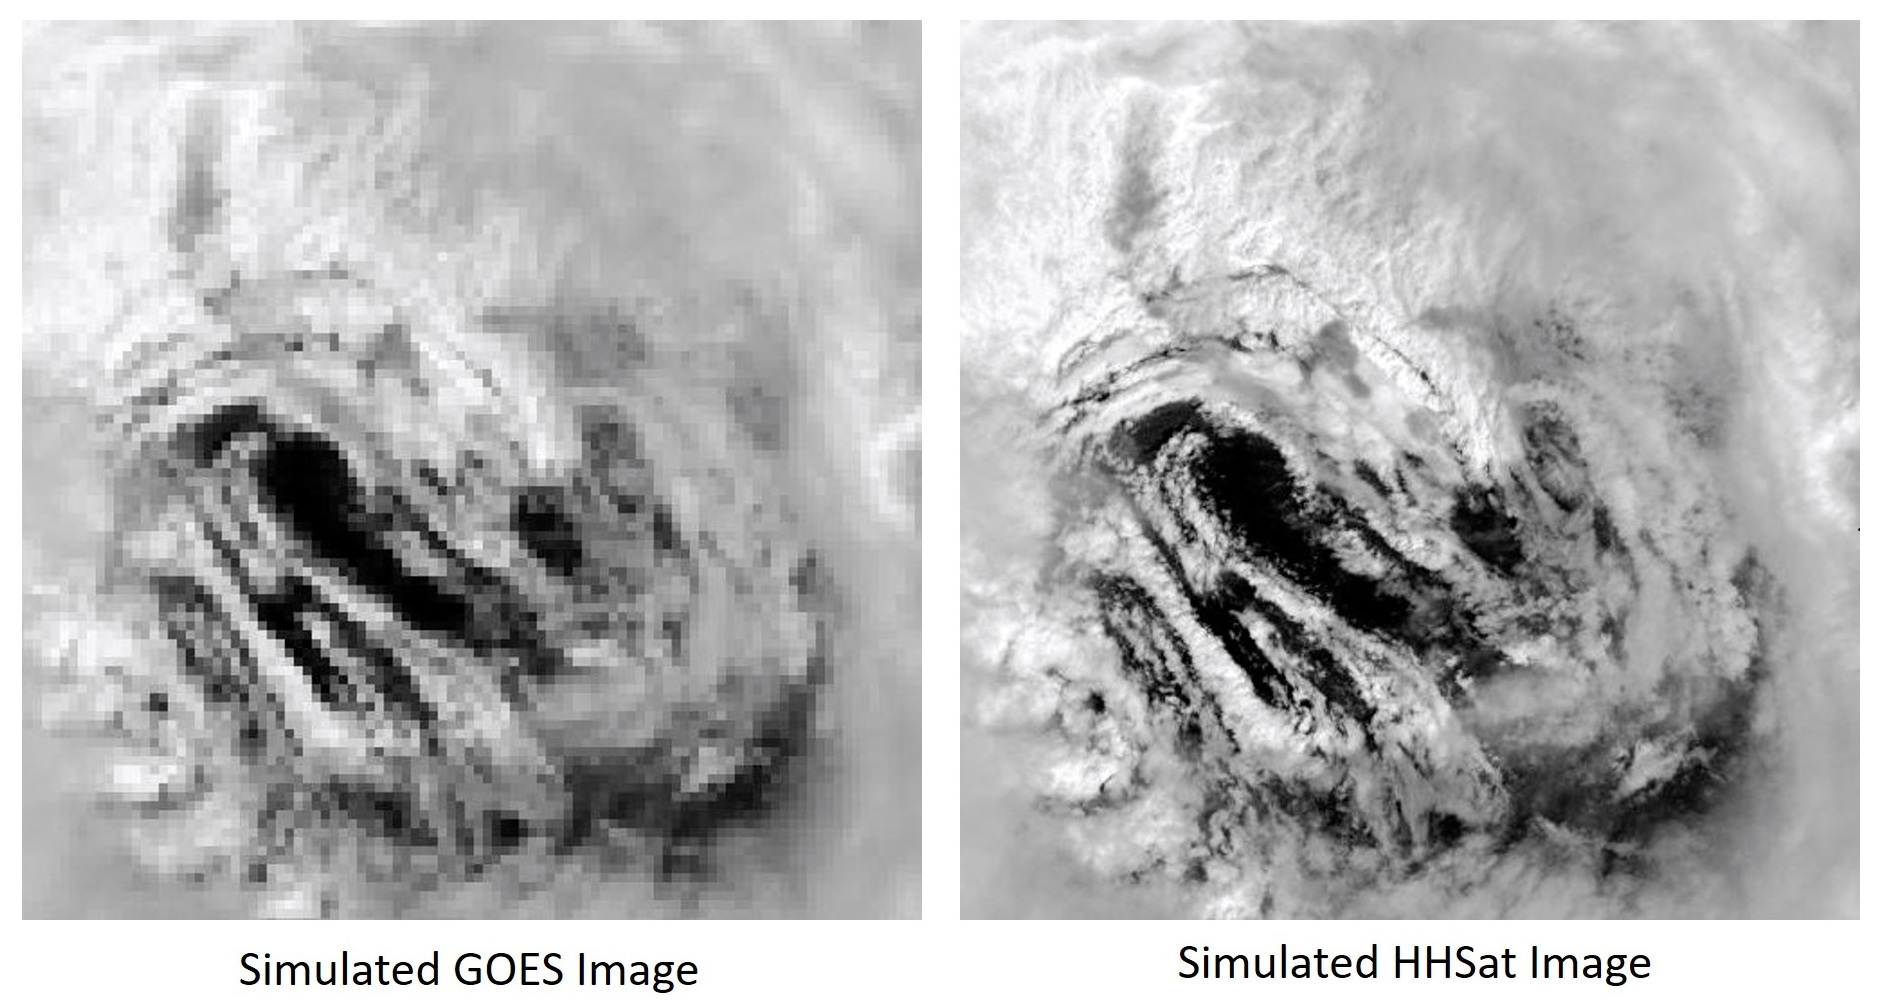
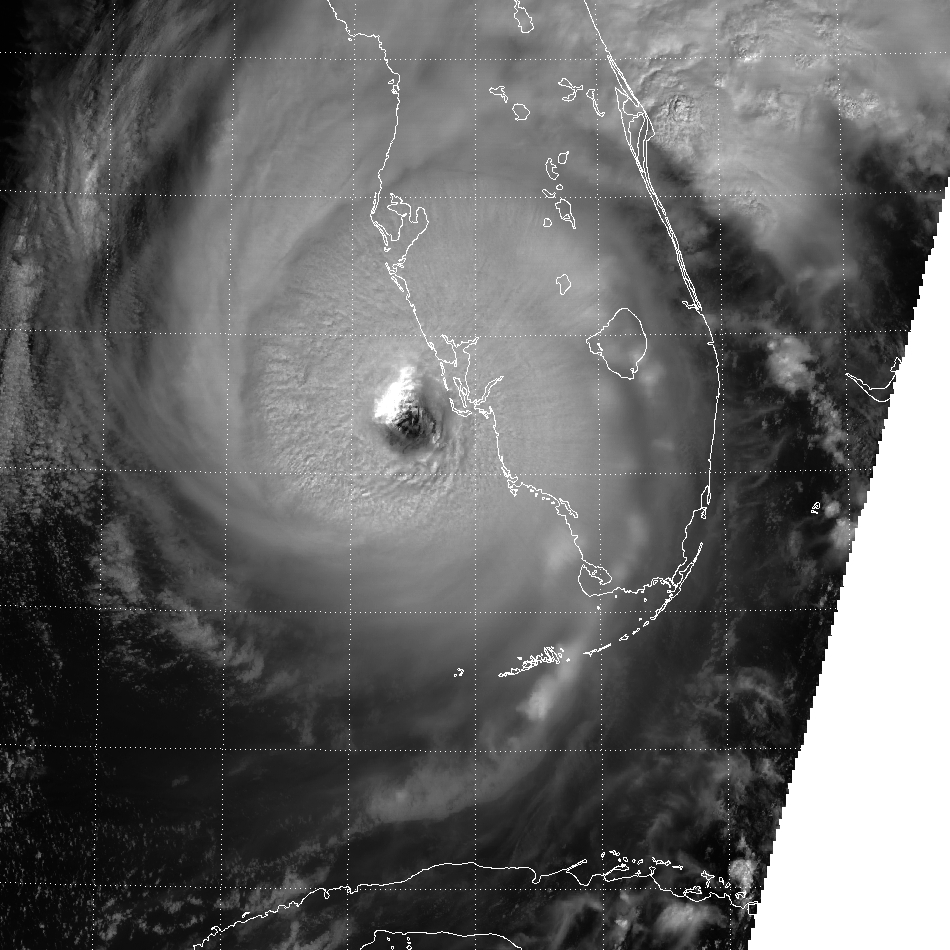
The first data product that would have been generated using the HHSats’ data is high-resolution visible band cloud imagery. The trio of cameras carried by each HHSat will have a total field of view of about 120°-by-30° (with the long axis oriented perpendicular to the satellite’s ground track) with an image scale of about 100 meters/pixel at nadir. Each triplet of overlapping images acquired simultaneously by an HHSat will cover an area of about 2,000-by-300 kilometers. By stitching together a sequence of such images acquired as the satellites move over the Earth, wide-area mosaics can be created with a length of at least 2,000 kilometers. The mosaic will be mapped onto a 100 meter/pixel grid with the line-of-sight geolocation of each pixel onto the geoid typically good to 100 meters or better. A simulated sample of such a HHSat mosaic acquired at about 15:40 GMT on September 28, 2022 is shown below.
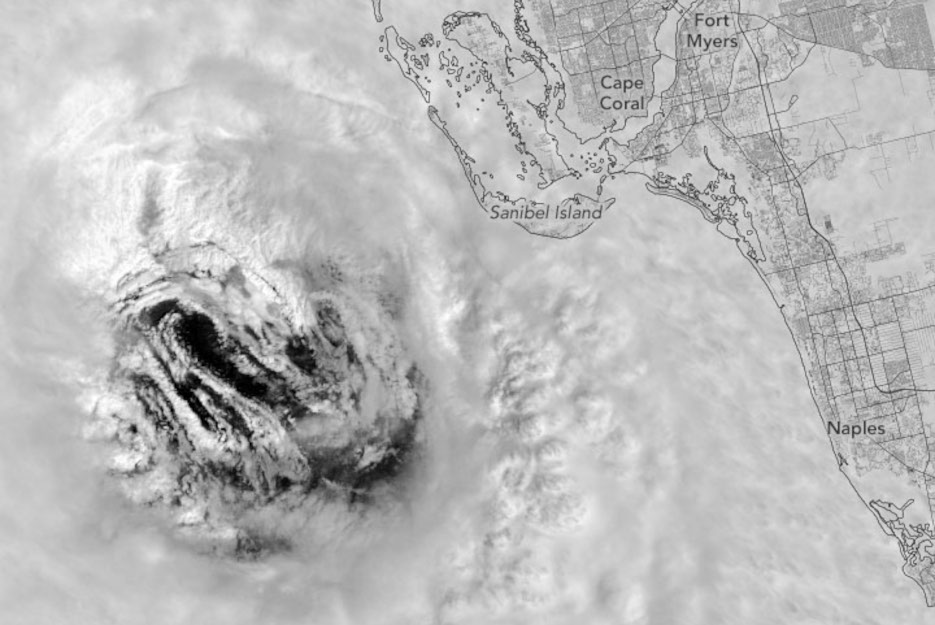
While the GOES Advanced Baseline Imager (ABI) can acquire images every five minutes over the continental United States, the Band 2 imagery in the red (roughly comparable to the bandpass of the HHSat cameras) has a nominal image scale of 500 meters/pixel at nadir. The HHSat imagery will have an image scale up to five times finer than this providing weather analysts a much clearer snapshot of the storm. Below is a simulated view of the eye of Hurricane Ian created using Landsat OLI imagery with a GOES ABI Band 2 image on the left and a simulated, full resolution HHSat image on the right. The huge improvement in the visibility of small-scale features that would be of use to weather analysts is readily apparent.
High-Resolution 3D Imagery
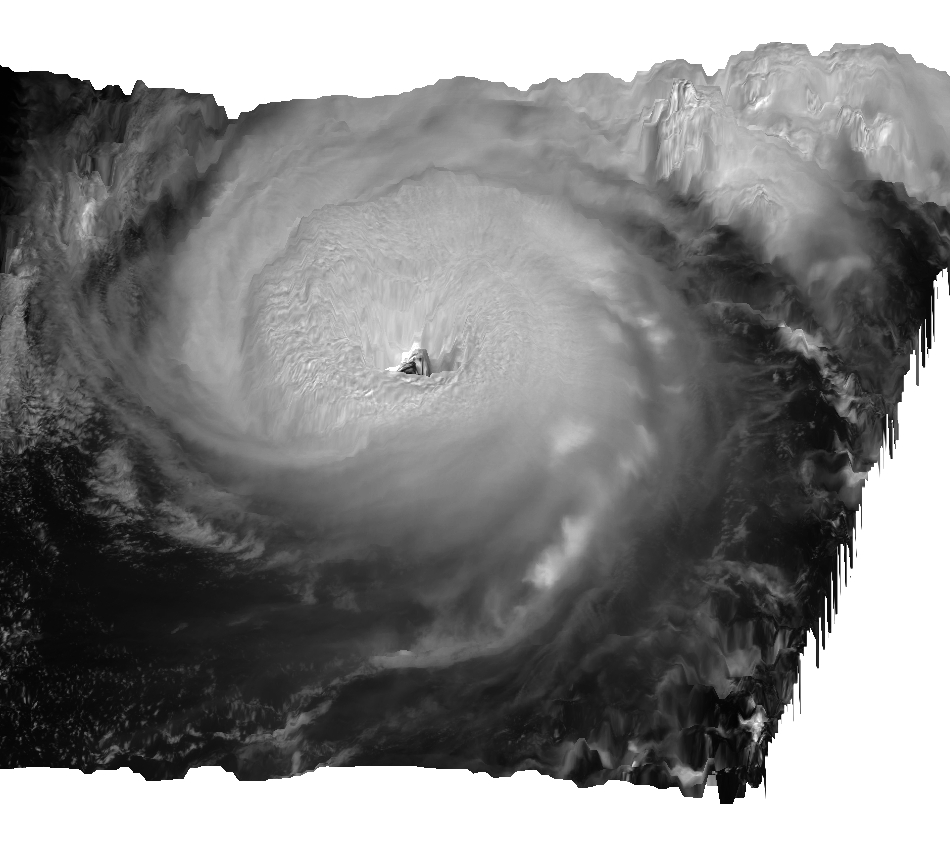
A unique feature of the HHSat constellation is its ability to make true-stereo observations of the clouds below. Typically, a pair of HHSat satellites will be spaced about 300 kilometers apart and target the center of their 120°-by-30° fields of view to a point half way between the satellites on the Earth below. During the course of the CyMISS (tropical Cyclone intensity Measurements from the ISS) project, flown as part of NASA’s CEO (Crew Earth Observations) activity on the International Space Station between 2014 and 2019 in support of HHSat development, the TWA Science Team developed algorithms to stitch together wide-angle, stereo image pairs to create 3D mosaics with a constant stereo angle across the image to aid weather analysts in the interpretation of features in a storm.
![]()
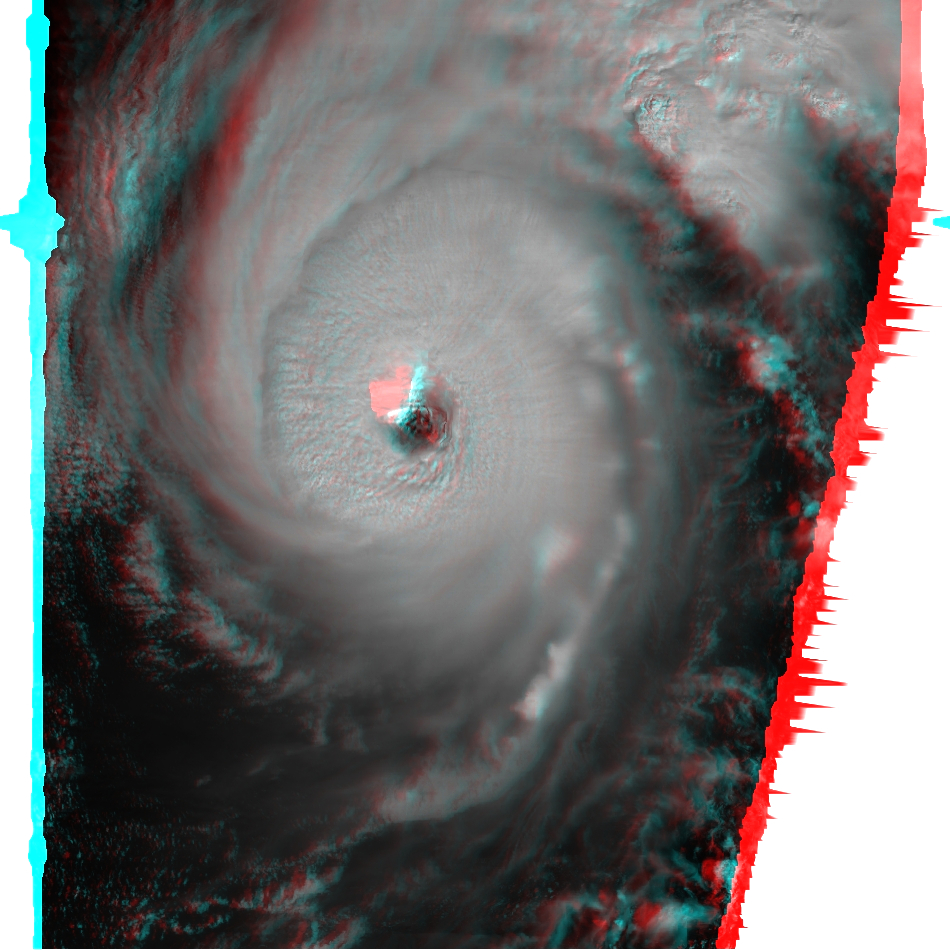
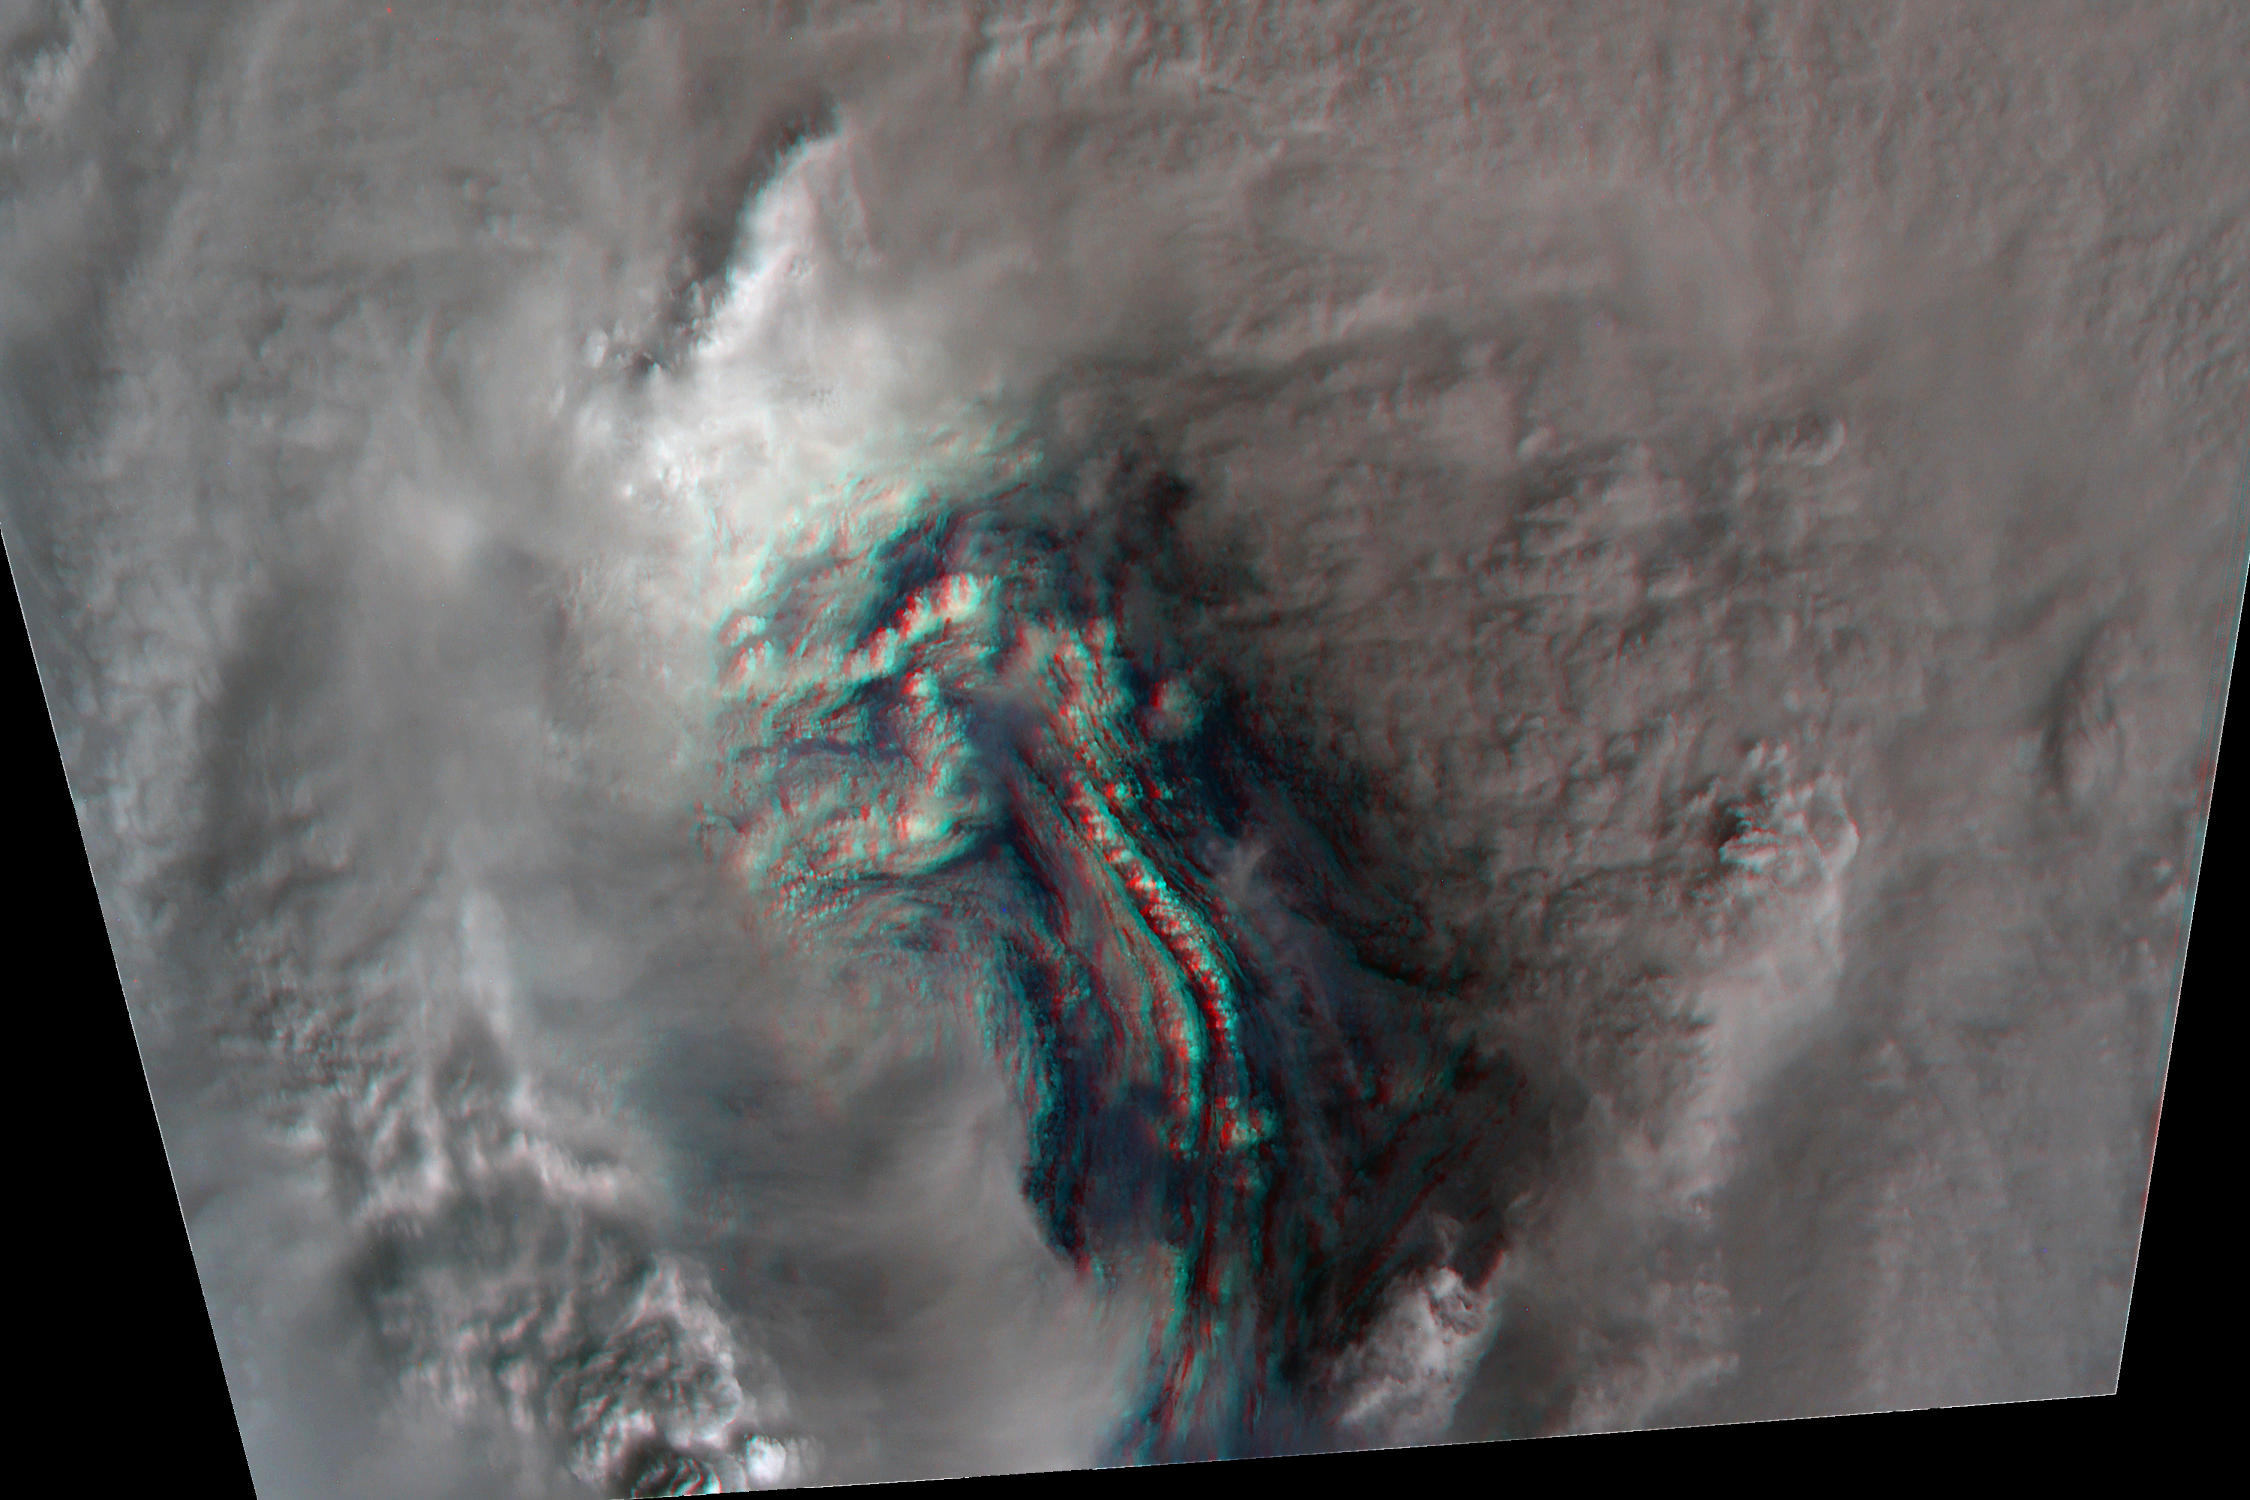
Above is a simulated 2D and a 3D image of Hurricane Ian as it appeared at 15:40 GMT on September 28, 2022. GOES ABI Band 2 imagery was used for the images while the GOES Cloud Height data product was used to provide information on the cloud height. Data does not exist to create a simulated high-resolution 3D closeup of the eye of Hurricane Ian. The closest analog would be the image below with an image scale of 100 meters/pixel showing the eye of Typhoon Soulik as it was observed on August 21, 2018 from the ISS in support of the CyMISS project. It readily shows the complex structure in the eye of this storm (for more information on these observations in particular and the CyMISS program in general, see “3D Views of Typhoon Soulik from the ISS – August 21, 2018”).
![]()
Cloud Altitude & 3D Wind Data
In addition to creating 3D images, the stereographic imagery from a pair of HHSats can be quantitatively analyzed using automated processes to measure the positions and altitudes of cloud features smaller than a kilometer to an accuracy of as good as 100 meters – a factor of five-times better than is done with GOES data. Below is a simulated HHSat cloud top altitude data product created using GOES Cloud Height data.
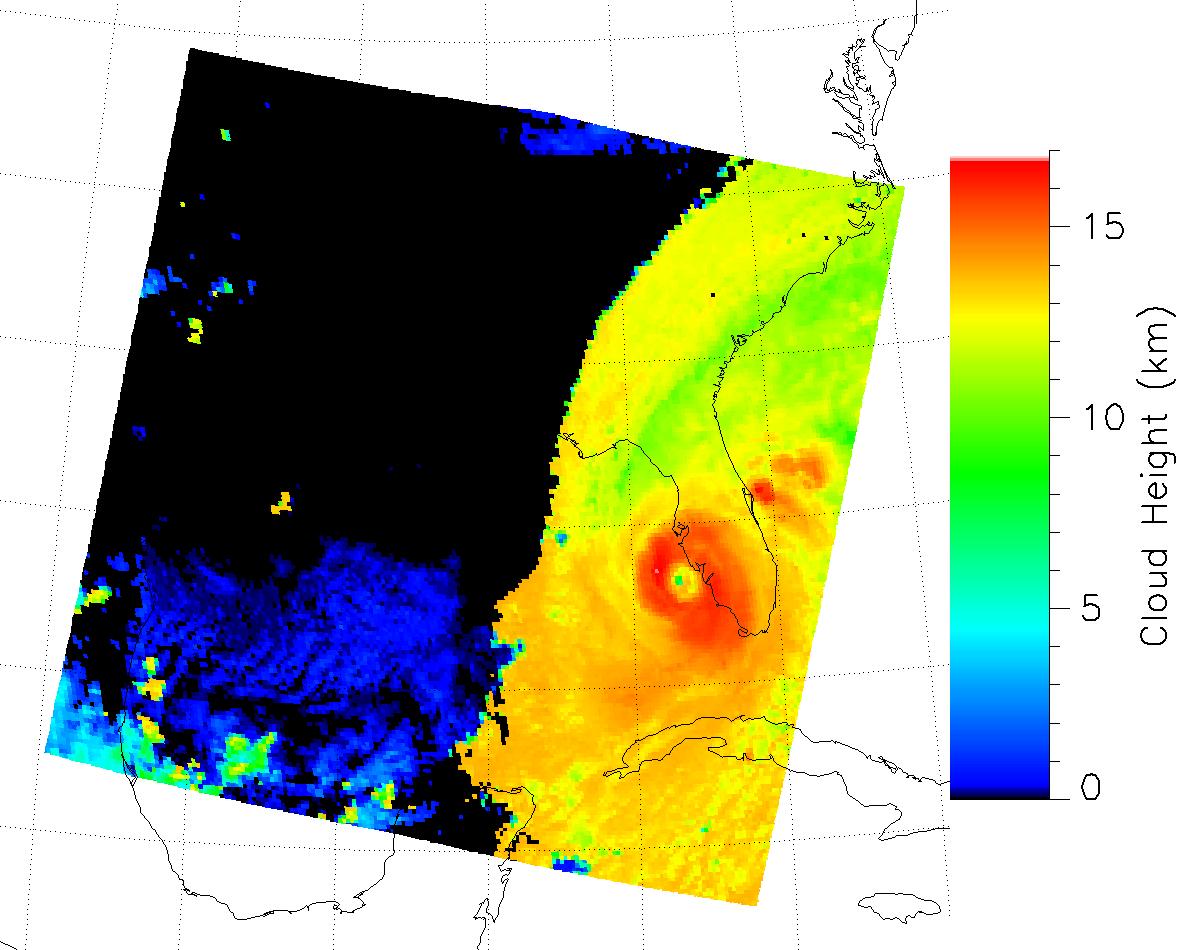
In addition to providing vital inputs for Numerical Weather Prediction (NWP) models used to forecast storms with much higher spatial resolution and altitude accuracy than currently available from satellites, these data can also be used to create 3D renderings of storms helping weather analysts to decipher storm features as a useful supplement to the 3D imagery previously discussed. Such a simulated rendering using GOES data is shown below.
By tracking the changing positions and altitudes of cloud features during the 40+ seconds it takes for those features to drift through the moving HHSats cameras’ field of view, it is also possible to determine the horizontal and (uniquely) the vertical winds in the scene observed by the HHSats in a technique analogous to that employed to create the GOES Derived Wind Motions data products. The HHSat wind data product, with a wind speed accuracy as good as 1 meter/second, a sub-kilometer spatial resolution and an altitude accuracy as good as ±100 meters, will be up to an order of magnitude better than the comparable GOES data product potentially producing up to hundreds of thousands of useful data points in a scene. This huge input of wind data will help with initializing the conditions for NWPs minimizing the amount of interpolation required and improving the accuracy of the resulting hurricane forecasting. Studies of using 1D Doppler LIDAR wind measurements from the recently completed ESA Aeolus mission has already shown that such satellite wind data improves the accuracy of hurricane predications (especially in regions not covered by NOAA and USAF Hurricane Hunter Aircraft) despite the low spatial resolution and sparse sampling of the data (see “The Impact of New Satellite Wind Measurements on Hurricane & Tropical Cyclone Forecasting”). The wide-area, high-resolution 3D wind data provided by HHSat should improve weather predictions to an even greater degree.
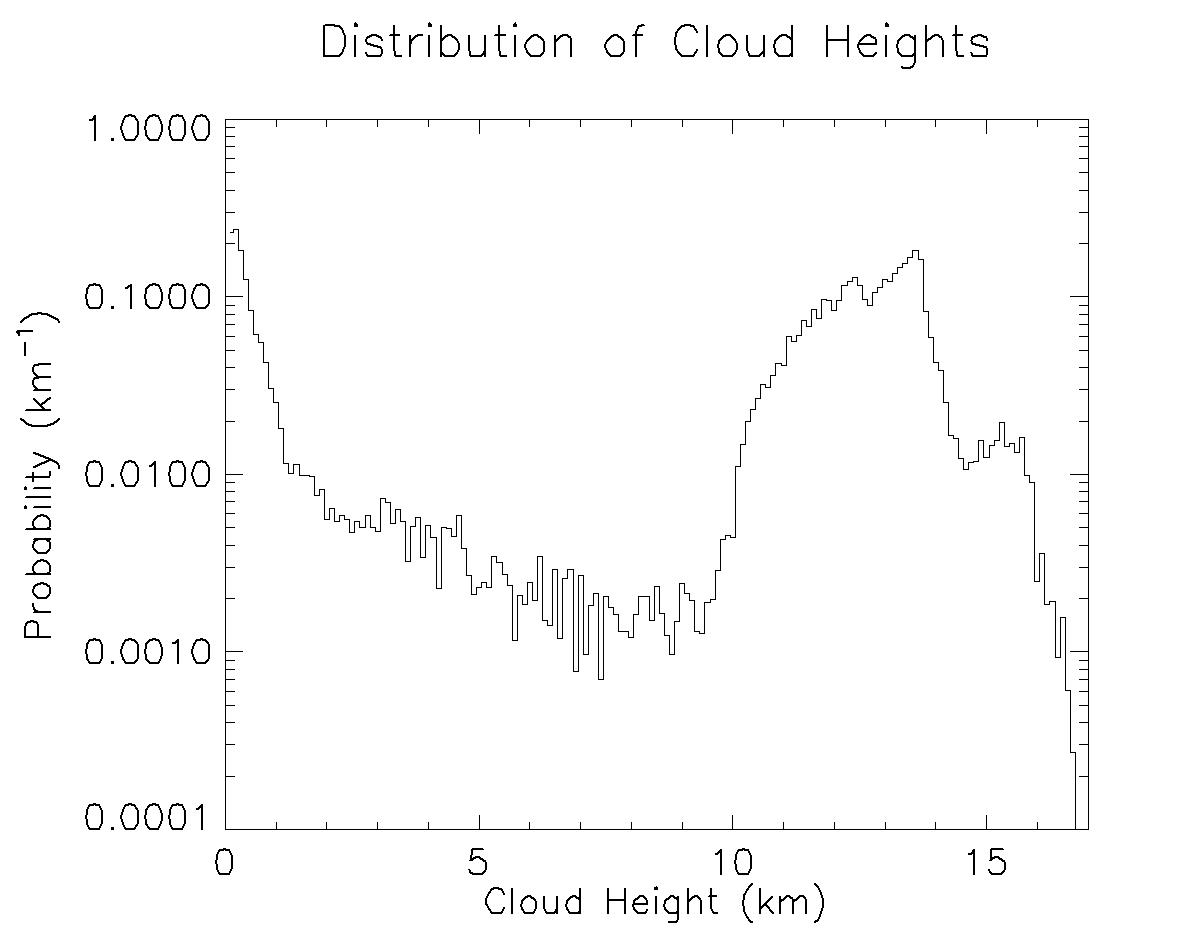
The illustration above shows the distribution of cloud heights in the simulated 2,000-by-2,000-kilometer HHSat scene and, to a good approximation, the relative number of 3D wind data points as well. Most of the wind data in the 10-to-15-kilometer altitude range is associated with Hurricane Ian itself while the other data points come from other parts of the scene as well as gaps in the hurricane’s cloud deck. The unique vertical wind measurements provided by HHSat will allow areas of strong convection, which can be associated with severe weather near the eye of the storm and its outer bands, to help improve the local forecasting of heavy rainfall, tornadoes, and other severe weather conditions.
Measuring Hurricane Intensity Using the Carnot Engine Model
While the cloud altitude and 3D wind data will provide vital inputs for NWPs to improve predictions of the future strength and track of hurricanes like Ian, the TWA Science Team has also developed a technique to remotely characterize the strength of tropical cyclones more accurately than is currently done using existing algorithms like the various forms of the Dvorak Technique and SATCON (SATelitte CONsensus). A new physics-based approach to determine the strength of tropical cyclones was formulated in 1994 by Kerry Emanuel (MIT and a member of the TWA Science Advisory Board) and Paul Joss (MIT and a now-retired cofounder of TWA). In 1988, Emanuel estimated the maximum theoretical strength of tropical cyclones by treating these storms as a thermodynamic system known to physicists as a Carnot Engine. Working for Visidyne, Inc. (the corporate antecedent of TWA), Emanuel and Joss found that the strength of a tropical cyclone could be determined using this model in combination with overhead remote sensing data from satellites (for more details, see “Using the Carnot Engine Model to Characterize Hurricanes from Orbit”).
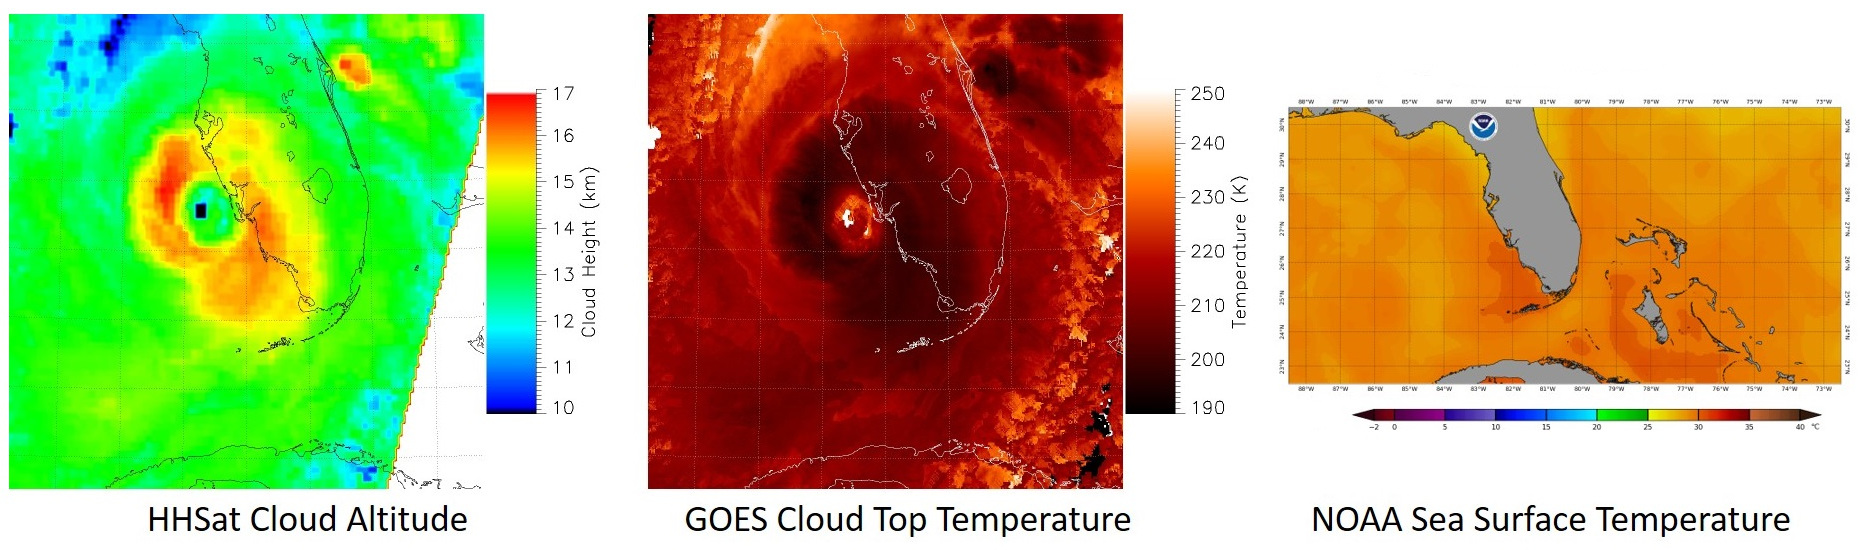
Using cloud top altitude data from HHSat, cloud top temperature measurements from GOES and sea surface temperatures compiled from various sources by NOAA, the TWA implementation of the Carnot Engine model can determine the central pressure of an intense hurricane to an accuracy of ±3.5 millibars – a factor a several better than can be done with other satellite-based techniques currently in use. The plot below shows the change in the central pressure of Hurricane Ian between September 22 and October 1, 2022 derived from multiple sources of in situ and remote measurements.
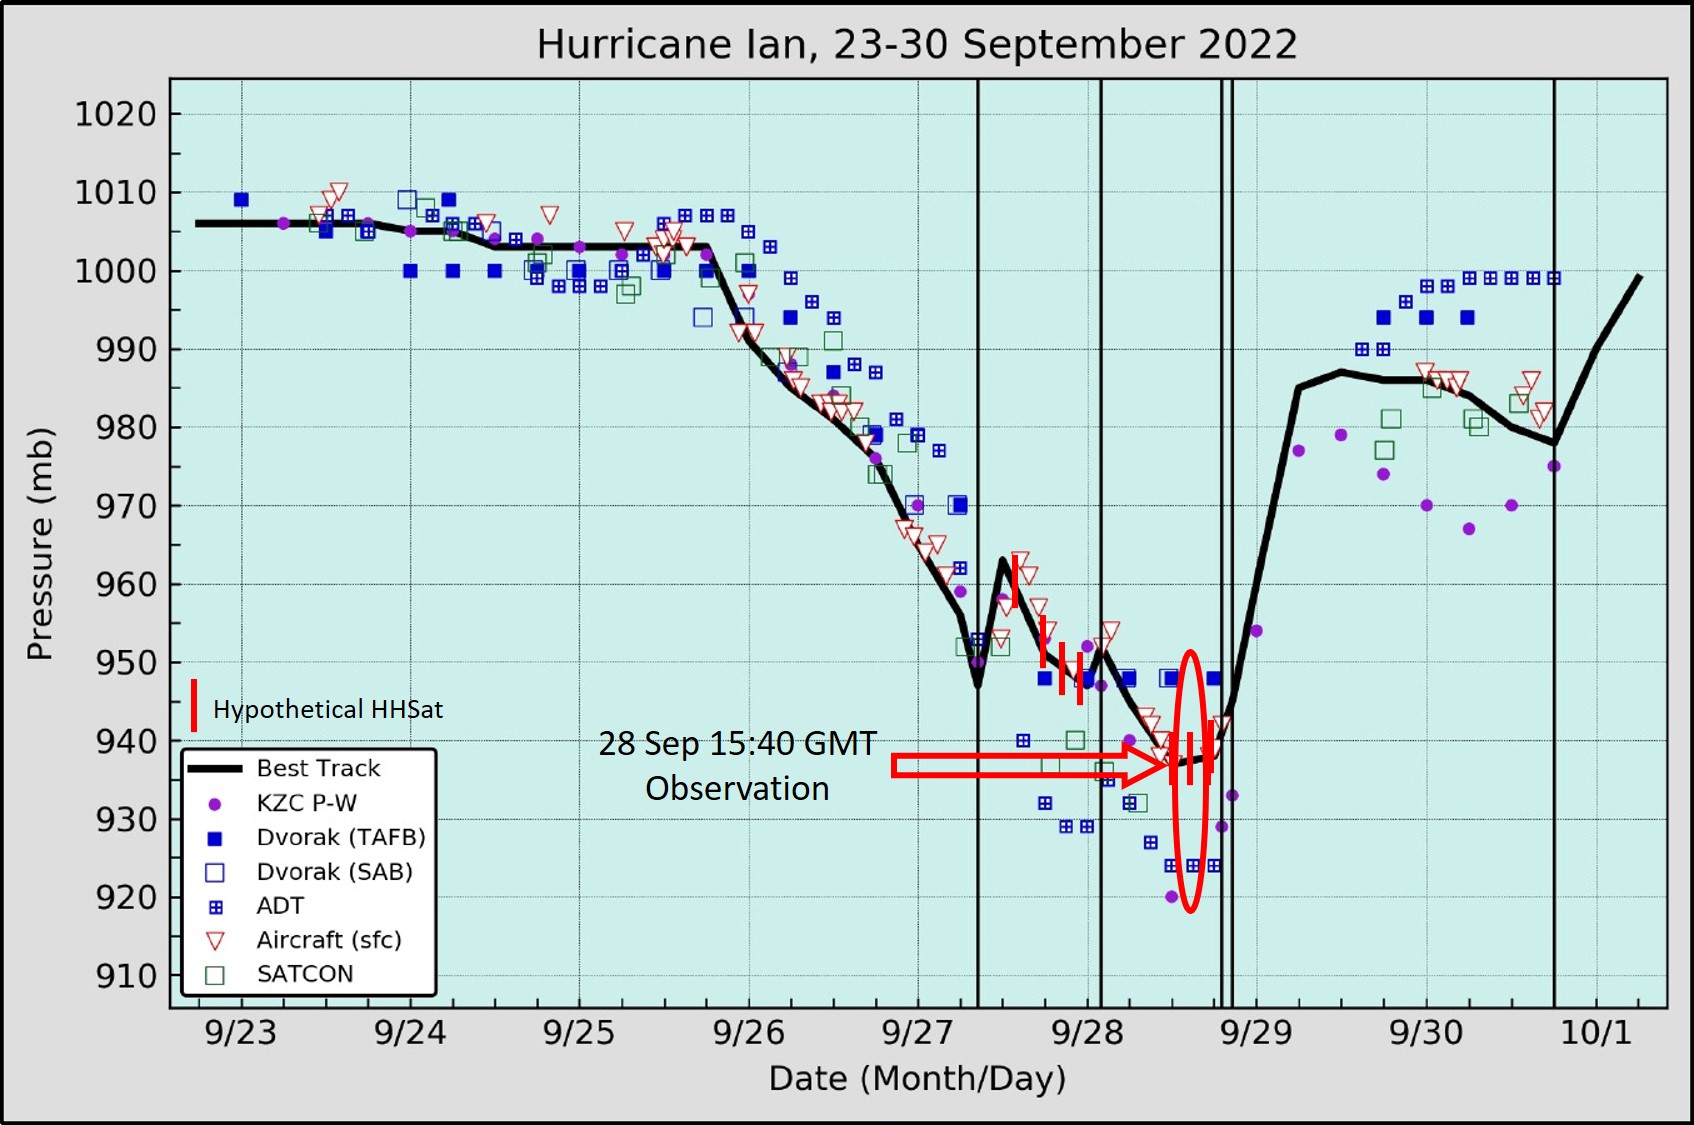
Based on the peer-reviewed validation performed to date, the Carnot Engine model technique TWA has developed would produce the most accurate result with tropical cyclones rated as Category 3 or stronger on the Saffir-Simpson scale (continuing investigations by the TWA Science Team is attempting to push the technique to less intense storms and characterize the accuracy of the results). As can be seen in the plot above, there is a lot of scatter in the data with the most accurate data coming from the Hurricane Hunter Aircraft. When HHSat would have made its hypothetical observations at 15:40 GMT on September 28, there happened to be an hours long gap in Hurricane Hunter Aircraft measurements. The addition of HHSat data at this crucial time, when the exact strength and future track of Ian was uncertain, would have provided crucial data for forecasting models helping to better tailor the response to the approaching storm by local authorities.
As the investigation by the TWA Science Team continues into the utility of HHSat data in the forecasting of tropical cyclones like Hurricane Ian, it does seem clear the huge volume of cloud altitude and 3D wind data, improved estimates of intensity using the Carnot Engine model, as well as the imagery and other data products to be used by weather analysts that would have been supplied by the HHSats would have made significant contributions to the forecasting of the strength and track of Hurricane Ian as well as aid in local forecasting of the effects of such a powerful storm.
Related Reading
Daniel Harkins, “Hurricane Ian demonstrated the need to improve both the hurricane forecast and the messaging”, TWA Blog, October 19, 2022 [Post]
Andrew LePage, “The Hurricane Hunter Satellites”, Drew Ex Machina, May 15, 2022 [Post]
Drew LePage, “Using the Carnot Engine Model to Characterize Hurricanes from Orbit”, TWA Blog, July 23, 2022 [Post]
Drew LePage, “The Impact of New Satellite Wind Measurements on Hurricane & Tropical Cyclone Forecasting”, TWA Blog, January 15, 2023 [Post]
General References
Lisa Bucci et al., “National Hurricane Center Tropical Cyclone Report: Hurricane Ian (AL092022) 23-30 September 2022”, National Hurricane Center, April 3, 2023 [Report]
Adam Voiland, “Staring Into Ian’s Eye”, NASA Earth Observatory website, October 1, 2022 [Post]

you are truly a just right webmaster The site loading speed is incredible It kind of feels that youre doing any distinctive trick In addition The contents are masterwork you have done a great activity in this matter
Wow, amazing blog layout! How long have you been blogging for? you made blogging look easy. The overall look of your web site is magnificent, as well as the content!