For native New Englanders such as myself, the mention of severe storms normally calls to mind Nor’easters – synoptic-scale extratropical cyclones which usually form just off the Atlantic coast of the United States which bring heavy precipitation and strong winds out of the northeast as they pass New England. During the winter months, these storms are frequently associated with heavy snowfalls in addition to the strong winds.
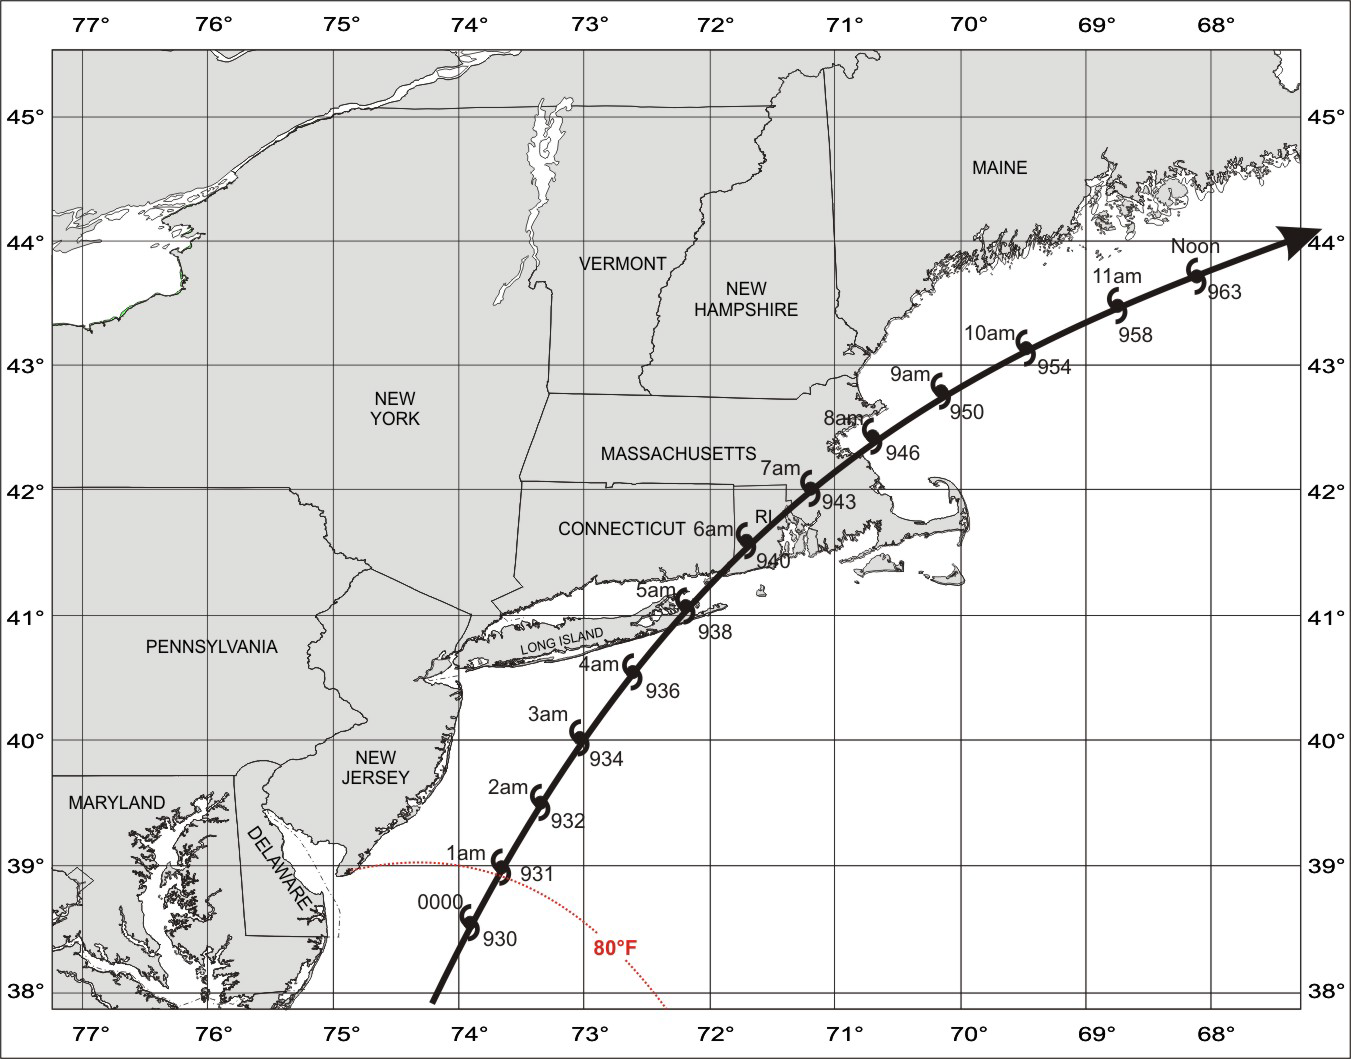
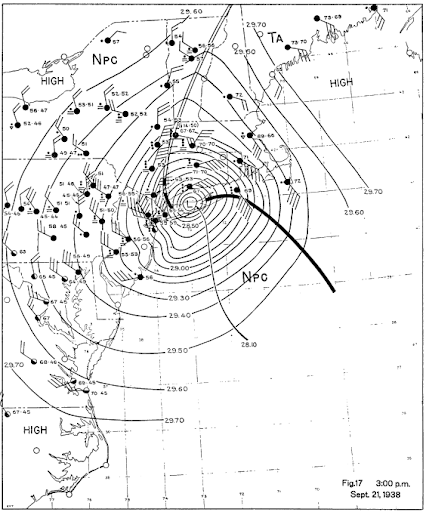
However, New England can also be affected by tropical weather systems such as tropical storms and hurricanes. The first such storm to be recorded passed through New England on August 26, 1635, around the same time as some of my English ancestors were settling in the Massachusetts Bay Colony, resulting in 46 recorded deaths – a fairly high death toll given the comparatively small number of European settlers living in the region at the time. By far, the deadliest hurricane to hit New England was an unnamed Category 3 storm which made landfall on September 21, 1938 and is estimated to have killed up to 800 people as well as caused $306 million in property losses (about $6.7 billion in today’s money).
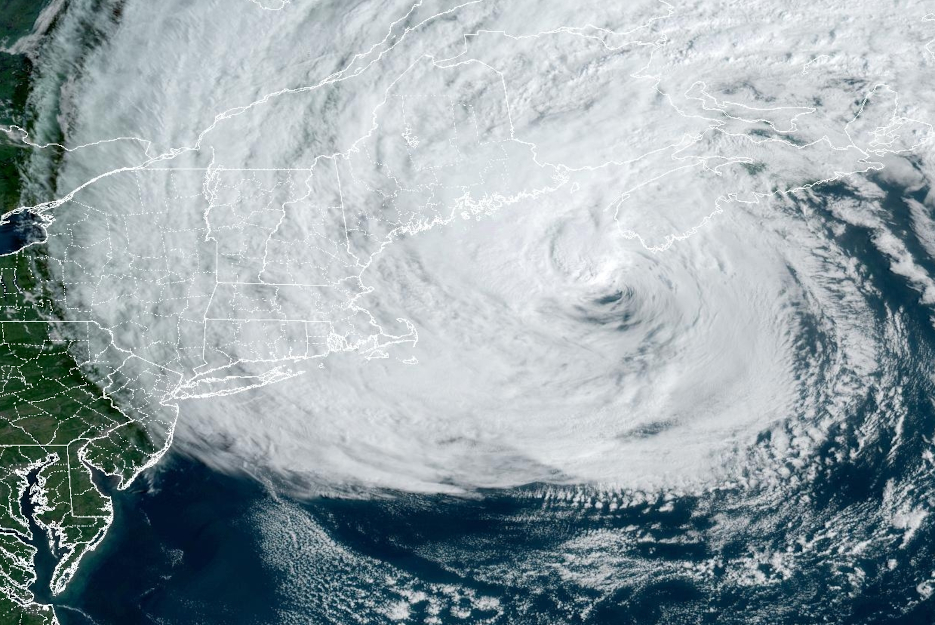
While the last hurricane to make landfall in New England was the Category 2 Hurricane Bob on August 19, 1991, there have been a number of hurricane remnants which have struck the region in recent decades as well as storms passing just off shore causing high winds, rain, and rough surf conditions which can cause coastal flooding. The most recent hurricane to just pass by Boston (where Tropical Weather Analytics is based) was Hurricane Lee on September 16, 2023.
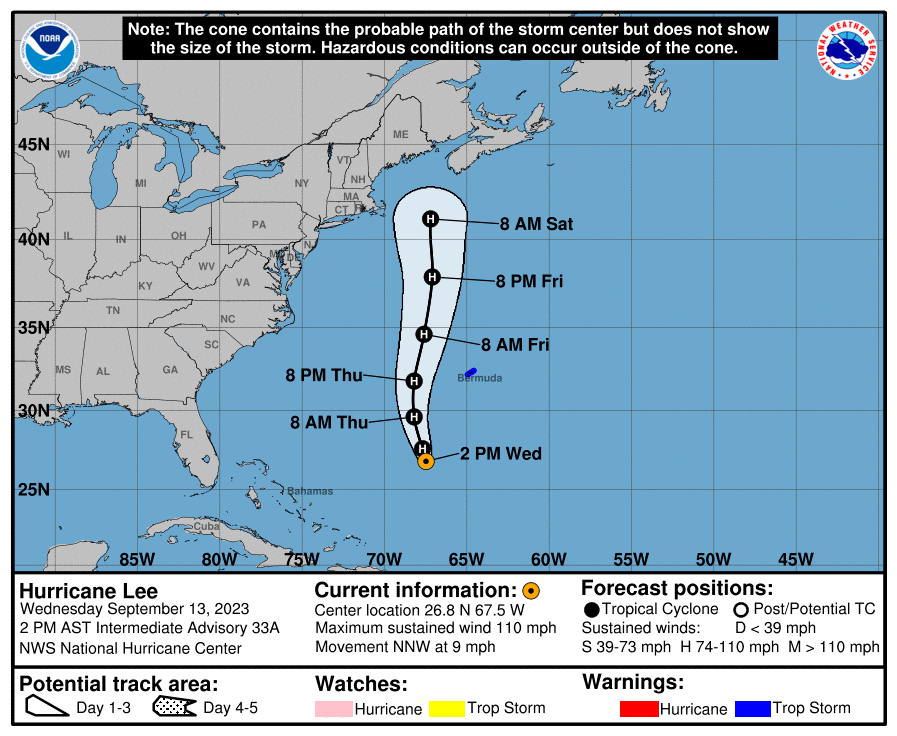
Hurricane Lee formed on September 5, 2023 from a tropical depression in the Atlantic followed by a period of quick intensification to a Category 5 hurricane on September 7. Lee stayed well out to sea as it slowly weakened and eventually turned towards the north on September 13 as a much weaker Category 2 storm. As it approached the waters off the New England coast, Hurricane Lee had weakened further to a Category 1 storm.
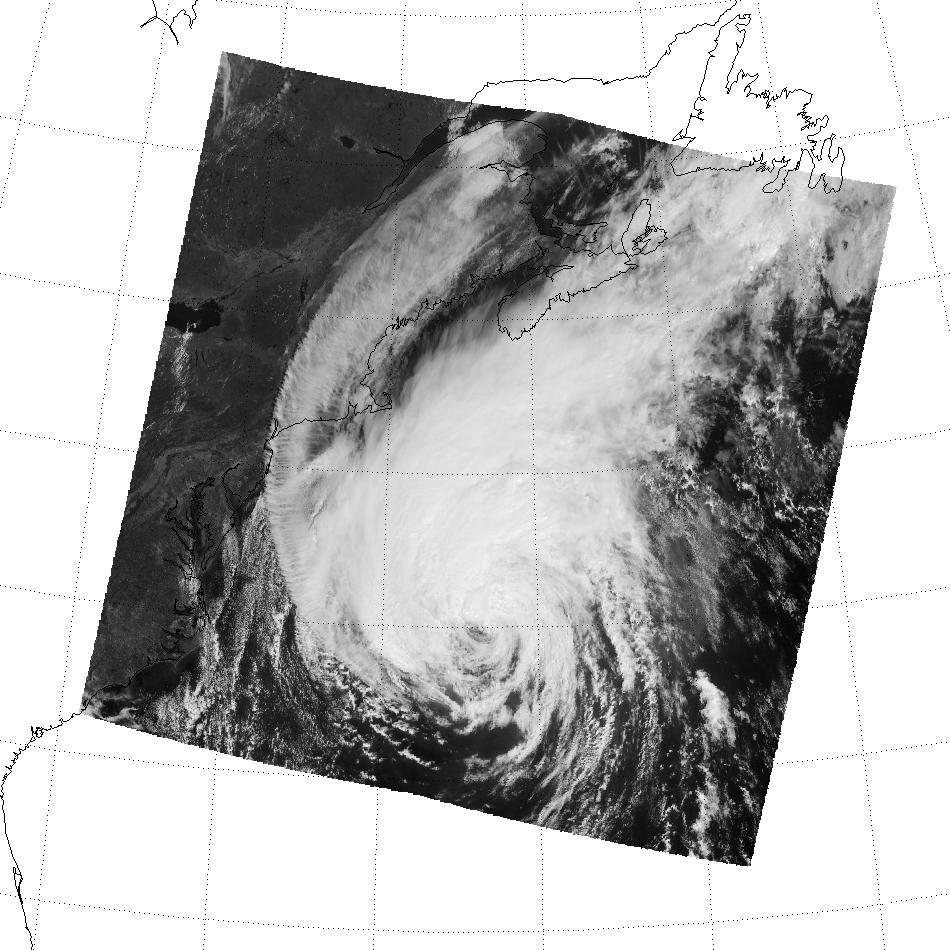
In the end, Hurricane Lee remained far enough out to sea so that only its outer bands directly affected the Boston area as it weakened to become a post-tropical storm by the morning of September 16. The video clip below, covering from 13:16 to 17:11 GMT (9:16 AM to 1:16 PM EDT) on September 16, shows Hurricane Lee passing New England and heading toward landfall in the Canadian Maritimes sporting tropical storm strength winds of about 70 mph (31 m/s) near its center.
As is frequently the case, the track forecast for Hurricane Lee remained quite uncertain in the days leading up to its pass by New England and into the Canadian Maritimes. Part of the issue with the accuracy of the various Numerical Weather Predictions (NWP) is obtaining a sufficient amount accurate wind data to initialize these complex models. Data on surface winds is readily available from a network of ground stations on land as well as instrumented ships and buoys at sea.
Obtaining accurate data about the winds aloft is a bit more problematic. Radiosondes are only launched twice a day from geographically scattered locations. More wind data are provided from instrumented commercial aircraft but, unfortunately, these flights would normally be diverted around a storm like Hurricane Lee to avoid the high winds and turbulence associated with the storm. Normally, NOAA’s Hurricane Hunter aircraft would be flying directly into such a storm to gather vital in situ measurements but, this fleet has been grounded recently due to maintenance issues. Only aircraft from the US Air Force Reserve 53rd Weather Reconnaissance Squadron have been available to monitor Lee from the air.
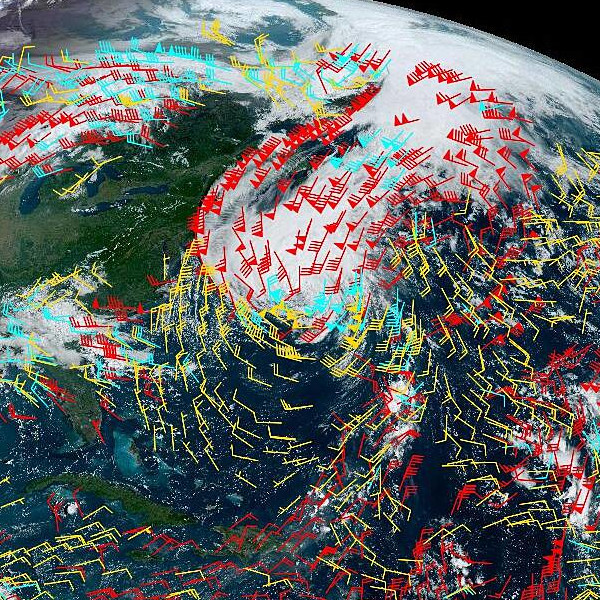
Satellite-based methods for measuring winds can provide wide area coverage to help fill in the gaps in data from other sources. Currently, the primary source of satellite wind data to initialize NWP comes from the GOES Derived Motion Winds data products which monitors the motions of clouds and contrasts in atmospheric water vapor to infer horizontal wind velocities over a wide area. Unfortunately, the spatial resolution is fairly coarse (no better than 10 kilometers), the wind measurement accuracy is only fair (about 7.5 m/s), and the altitude accuracy is very poor (on the order of kilometers), especially at high altitudes. The poor altitude accuracy makes it very difficult to accurately characterize the winds which will dictate the future path of the storm as well as to detect wind shear which has an important effect on the further development of a hurricane. Better satellite wind data are needed to help provide improved hurricane forecasting (as well as weather forecasting in general).
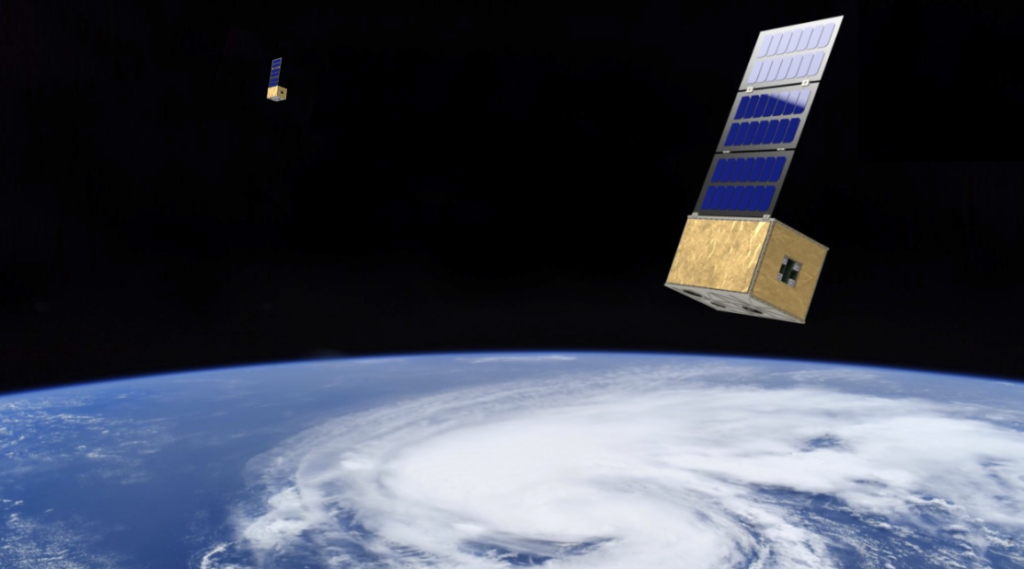
The Boston-based Tropical Weather Analytics (TWA) and the Montreal-based Canada Weather Analytics (CWA) are currently developing the Orbital Weather Warning System (OWWS) to provide wind and other data to help improve weather forecasting. The first elements of the OWWS are the Hurricane Hunter Satellites (HHSats) being developed by TWA. The initial constellation of five satellite-pairs will use 12U CubeSats in 500-kilometer, Sun synchronous orbits fitted with an array of three visible cameras to provide wide-area, daytime stereographic imagery with a pixel scale of about 100 meters at nadir. In addition to generating 2D cloud imagery with a resolution superior to that from JPSS and GOES, HHSat will provide unique 3D cloud imagery to aid weather analysts. The first pair of HHSats is to be built by Phantom Space Corporation which will launch the satellites in 2025 and operate them during their planned five-year lifetime.
The unique high-resolution stereographic imagery produced by HHSat will be used to measure the altitudes of sub-kilometer size cloud features in a scene to an accuracy as good as ±100 meters. By analyzing the motions of these clouds through a sequence of stereo images, the wind speeds at those altitudes can be measured to an accuracy approaching 1 m/s using a technique analogous to that used for the GOES Derived Wind Motion data product. But unlike the GOES wind data product, the HHSat will be capable of measuring not only horizontal winds but also the vertical component of the wind. In a typical 2,000×2,000-kilometer scene (the minimum design requirement for the swath size), HHSat data can potentially provide hundreds of thousands of 3D wind measurements with better spatial resolution, measurement accuracy, and far superior altitude accuracy than the 2D GOES Derived Motion Winds data product.
A schematic diagram of the structure of a classic hurricane is shown in the illustration below. The rain bands typically form a spiral shaped pattern centered on the eye of the hurricane with these bands moving counterclockwise due to the Coriolis effect on the flow of air towards the eye. Once at the eye, the air is forced upwards and flows outward at high altitudes. This clockwise, high-altitude outflow can entrain high altitude cirrus clouds which can trace the motion of the air.
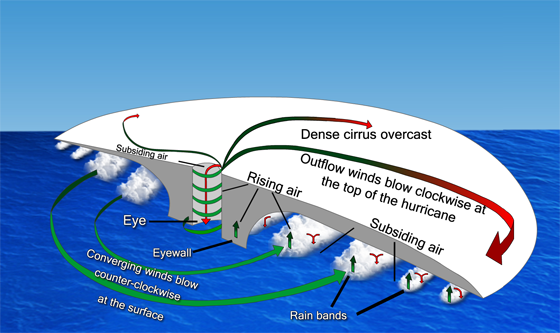
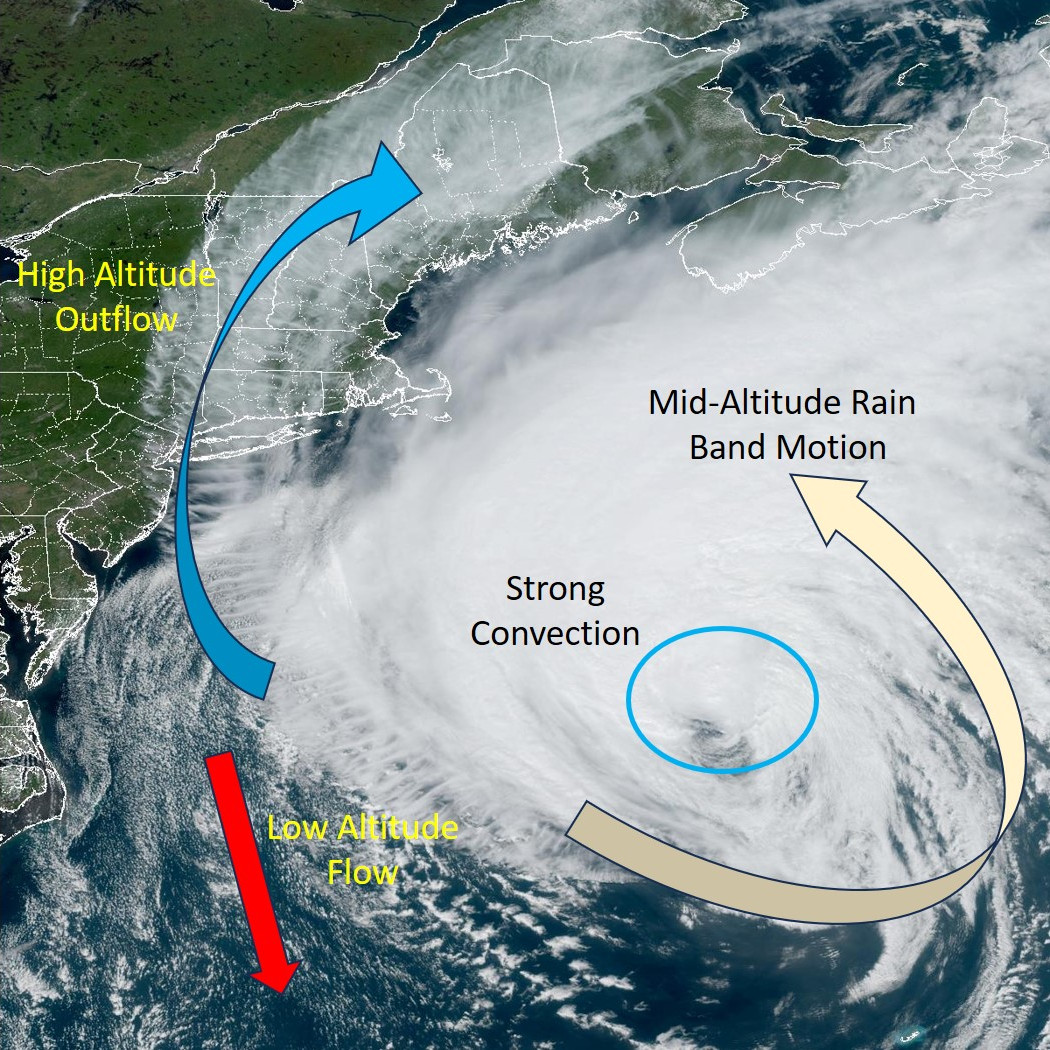
The video clip below shows the motion of the clouds associated with Hurricane Lee from 15:16 to 19:11 GMT (11:16 AM to 3:11 PM EDT) on September 15, 2023. Clearly evident are the different motions of clouds at various altitudes as indicated in the diagram below. With the huge number of HHSat 3D wind data points with altitudes measured stereoscopically to an accuracy as good as 100 meters, the altitude and location of vertical wind shear can be directly measured or, at very least, constrained with far better accuracy than can be done with GOES data alone, which relies on a less accurate sounding method to measure altitude. This HHSat wind data set, when combined with wind data from other sources, can provide much more accurate initial conditions for NWPs improving the accuracy of their forecasts.
Because of HHSat’s unique ability to measure the vertical component of winds, its data can be used to characterize regions of strong convection in a hurricane shown in the diagram above. These areas of strong convection are frequently associated with more intense rainfall rates and other severe weather events such as tornadoes. Such information, which is not currently available routinely, can improve the accuracy of predictions of intense rainfall (which can lead to flooding) and aid in creating hyperlocal forecasting of the effects of a hurricane. Had the HHSat constellation been in orbit, it certainly would have provided vital data to improve the forecasting of Hurricane Lee during its 11-day trek across the North Atlantic.
Related Reading
Andrew LePage, “The Hurricane Hunter Satellites”, Drew Ex Machina, May 15, 2022 [Post]
Drew LePage, “The Impact of New Satellite Wind Measurements on Hurricane & Tropical Cyclone Forecasting”, TWA Blog, January 15, 2023 [Post]
Drew LePage, “How Satellite Wind Data Impacts Weather Forecasting”, TWA Blog, May 23, 2022 [Post]
John Devore, “High Definition Hurricanes – Improving Tropical Cyclone Models & Forecasts”, TWA Blog, August 11, 2022 [Post]
John DeVore, “The Need for More Data for Hurricane Forecasting”, TWA Blog, August 5, 2022 [Post]

This is my first time pay a quick visit at here and i am really happy to read everthing at one place